GIS in Maintenance Peer Exchange
Harrisburg, Pennsylvania
April 10-11, 2018

Host Agency
Pennsylvania Department of Transportation
Participating Peer Agencies
North Carolina Department of Transportation
Alabama Department of Transportation
Georgia Department of Transportation
Maryland State Highway Administration
Acknowledgements
The U.S. Department of Transportation John A. Volpe National Transportation Systems Center (Volpe Center) in Cambridge, Massachusetts, prepared this report for the Federal Highway Administration’s (FHWA) GIS in Transportation Program. The Volpe Center project team wishes to thank the participants in the peer exchange, which are listed in Appendix A, for providing their experiences, insights, and editorial review. The time they kindly provided was vital to preparing the exchange and reviewing this final report.
Table of Contents
1. Introduction
Purpose
The purpose of this peer exchange was to showcase the Geographic Information System (GIS) applications being used for maintenance purposes across the U.S. and discuss challenges, needs, and issues agencies face in implementing maintenance activities. The Pennsylvania Department of Transportation (PennDOT) agreed to host the peer exchange and demonstrate their maintenance GIS applications, Maintenance-IQ, and discuss the process used in creating the platform.
Background
Standard maintenance activities include items related to physical infrastructure (such as repaving, restriping and crack sealing roads; inspecting and repairing bridges; and installing/replacing culverts) as well as more administrative tasks such as tracking needs for maintenance; creating work orders and notifications; and conducting project cost accounting tracking. These activities each have separate work cycles, and agencies often use separate systems to manage each work flow. For example, PennDOT noted that their previous model used about 50 separate systems to manage overall maintenance needs for the State. PennDOT’s Maintenance-IQ system was constructed to allow a GIS-based maintenance management system, and eliminated the need for using many of the aging, task-specific applications they had been using.
GIS is used in maintenance activities because of its utility in accomplishing work, but also to comply with regulations applicable to State DOTs. One such requirement is the submission of data through the Highway Performance Monitoring System (HPMS), required under Title 23 Part 420 of the Code of Federal Regulations. This reporting requirement mandates that States submit data of varying types on all roads, including a larger data set on Federal-aid funded roads. This yearly data submission also includes providing Linear Referencing System (LRS) data to enable analysis of roads and conditions.
Maintaining roadway information in a GIS system also enables more efficient planning, particularly when planners can locate layers of maintenance work before beginning construction and prevent repairs which damage newly replaced infrastructure (such as needing to cut through a newly paved road to repair pipes below it). GIS data sets related to maintenance also allow for analyzing the extent of problems in a single area or prioritizing work in areas with greater need. Using a buffering capability, States can identify potential project-level environmental impacts, which allows for better planning and project design.
The challenge for State DOTs to meet all these requirements through their GIS systems has led to the creation of numerous tools, including PennDOT’s Maintenance-IQ. Maintenance-IQ, in particular, has integrated many data systems to provide an enhanced user experience that simplifies the tasks one would need to complete in other GIS systems to perform data analysis. The path to making the system was long, and required a coalition within the State DOT, mature data, and an ability to hire an outside contractor to create the new system. The process also required the help of champions within the agency who were committed to creating a better tool.
The Federal Highway Administration’s (FHWA’s) GIS in Transportation program sponsored the peer exchange. PennDOT hosted the peer exchange in Harrisburg, PA. Participants included staff from PennDOT and representatives from North Carolina Department of Transportation (NCDOT), Alabama DOT (ALDOT), Georgia Department of Transportation (GDOT), and Maryland State Highway Administration (MDSHA). Nate Reck, the consultant from GeoDecisions who worked on developing Maintenance-IQ, was also present.
The peer exchange was held over the course of two days. PennDOT began the exchange by presenting an overview of Maintenance-IQ and a summary of their experiences developing the tool. This was followed by a series of presentations from each other State on their maintenance and GIS programs and needs, and discussions on topics related to tool development. The exchange concluded with a discussion of next steps and final remarks from FHWA that summarized recurring themes. See Appendix A for the peer exchange agenda, including roundtable discussion topics.
↑ Back to Top
Presentation from PennDOT
The peer exchange began with a presentation from PennDOT on Maintenance-IQ. PennDOT staff described their working tools and environment before the creation of Maintenance-IQ. Prior to its development, they were routinely using over 50 separate systems to conduct statewide maintenance tracking, planning, accounting, surveying, and reporting. The systems ranged from financial software to asset management databases, and were difficult to use. Some of these systems were decades old and had user interfaces that were inefficient and not intuitive, discouraging use and making the agency ‘data rich and information poor.’ Using data from these systems to create maps and do analyses was a lengthy process, which involved identifying the correct data sets from multiple databases, pulling them together and sending them for processing by PennDOT’s GIS experts, who would then create maps individually for maintenance needs.
As PennDOT explained, using data in planning and decision making surrounding maintenance has become an integral factor for maintaining a large inventory of assets in a financially constricted environment. To optimize the performance of assets, data and analyses are critical for appropriately prioritizing improvement projects and upholding maintenance cycles. PennDOT wanted to make this process more efficient by integrating data and applications into one, user-friendly system (see Figure 1, below). In order to successfully implement this integrated system, PennDOT extensively revamped its data entry and QA/QC processes to ensure data integrity.
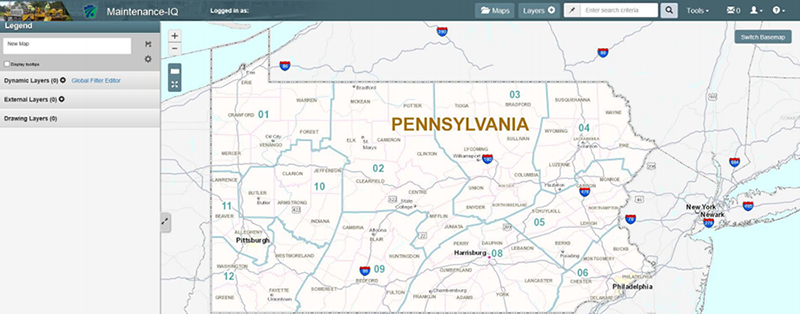
Figure 1. Illustration. Screenshot from PennDOT’s presentation on the Maintenance-IQ system.
PennDOT’s first year of tool development on Maintenance-IQ focused on the data itself—how to clean it, join it, warehouse it, and create a structure to support integration. Using primarily Oracle databases and an outside consultant, PennDOT began adding data from their systems for business intelligence, asset management, and project management. This data is only readable through Maintenance-IQ, not writable, and is refreshed once daily. With a large investment in this first year, the system was up and running in an early form, and accessible to users. The user interface was planned extensively, to ensure that accessing information was easy, intuitive, and replicable across the State. The ability to export a specialized map and then import it in a different county or area facilitates an exchange of reporting techniques and reduces the effort needed by entry level users to pull data from the system. Standard data sets included in Maintenance-IQ have increased gradually over time, with user requests driving additions in order of greatest priority and widest use.
PennDOT demonstrated the current version of Maintenance-IQ and the analyses users can build, and fielded questions on the tool’s development. The processes PennDOT undertook to create the system are described in the following sections, as well as the ways other States at the peer exchange have created similar innovative systems.
↑ Back to Top
Data Collection and Deployment
The peer exchange participants’ experiences with managing GIS and maintenance applications provided many examples of how data can enhance decision making, allow for greater efficiency in work, and help streamline the planning process. Central to the efforts of these DOT maintenance departments was an understanding of what needed to be maintained, the current conditions of pavement, culverts, guardrails, and other assets, and how maintenance projects could best be planned to avoid conflicts and harness synergies. The data required to perform all these tasks is large, diverse, and difficult to maintain; however, the agencies at the peer exchange described their methods for simplifying collection processes, standardizing data entry, and making this data transparent both internally and externally.
Collecting Data
Data collection was a topic of much discussion at the peer exchange, especially when discussing how to standardize information across systems, ensure accuracy in collection and geo-locating infrastructure, and simplifying the user experience for those interacting with these systems. Multiple States were using data collection applications to simplify and streamline the collection process. Many of these applications were run from iPads or other mobile devices in the field.
Data collection through applications ranged from text entry to photos or locational data, depending on the application and data type. MDSHA described their use of the Survey 123 application for iPads, a system that is integrated directly into ArcGIS. The Survey 123 adoption helped to identify locations for some of the projects they were tracking in two other systems (eTAC and MCARS), which housed project information but had no ability to display it spatially. The Survey 123 system was also used by ALDOT. PennDOT described their use of the GeoSnap application, which allows field technicians to take a picture of the asset that needs work and automatically collects the latitude and longitude of the location where the photo was taken. Then, the application auto-locates the closest State route to assist in planning for the maintenance work. Within the Maintenance-IQ system, these images can then be linked to assets so that the collected records are available with the asset record.
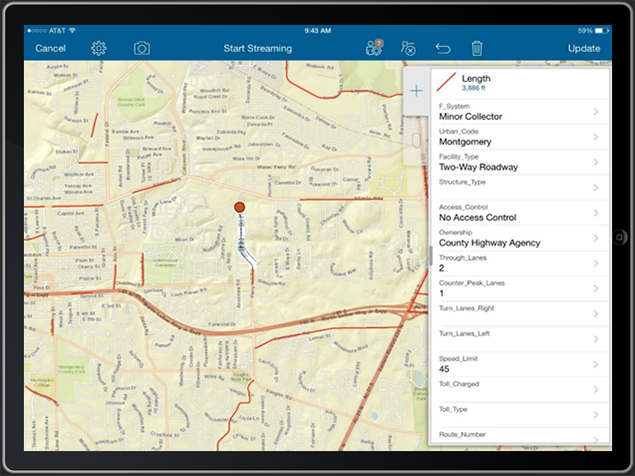
Figure 2. Illustration. Example of a data entry screen on an iPad from ALDOT’s presentation.
ALDOT built multiple custom applications for data collection, which tremendously improved the quality of data collected in the field (see one example in Figure 2, above). Their most recent program uses drones to help automate data collection. The use of drones ensures greater accuracy in collection, and has the potential to create 3D renderings of urban areas. ALDOT’s drone program has been used to assist with incident management, emergency weather situations, and assessing damages, etc. Setting up this program took two years and multiple certifications, as well as collaboration with others entering the drone field through a working group.
Although PennDOT has compiled a large amount of data in their Maintenance-IQ system, they are still continually improving it by adding more data. The next steps in PennDOT’s development of Maintenance-IQ involve refining their available sets of data and adding a temporal aspect to their data sets to allow for performance reporting. The Facilities Division was the second largest user of the Maintenance-IQ system after the Maintenance Division, and requested that a high priority be placed on integrating asset management data into the application. PennDOT is also moving forward in data efforts, including the drafting of new Standard Operating Protocols on data integrity. Another area of growth is in digital collection applications (discussed in the next section), which PennDOT is rolling out to field staff to seamlessly collect data while on site.
Open Data Access
The need for increased transparency internally and externally in the presentation of data led multiple States at the peer exchange to implement open data portals. These portals allowed users (either within the DOT, or the public at large) to access some of the GIS data collected and used in analyses. Three portals for open data were discussed from NCDOT, ALDOT, and MDSHA.
Open data access for NCDOT is offered through GO! NC, a platform they created with some similarities to Maintenance-IQ (see Figure 3, below). NCDOT was moved to create the platform through trying to meet requirements for planning, including a Highway Maintenance Improvement Program, a Bridge Maintenance Improvement Program, and a Routine Maintenance Improvement Program. Since the available funding for maintenance did not meet the total needs, NCDOT needed help in prioritizing and planning their maintenance investments to produce the best results. GO! NC makes data on all projects across the State available, so that conflicts between State and local projects can be identified. The system also includes a dashboard (internal), which allows for an evaluation of progress toward targets, such as the number of curb ramps installed, and to identify areas of particular need. ALDOT’s open data is offered through an ArcGIS online portal, which provides bridge data, rest area maps, traffic data, and query capabilities.
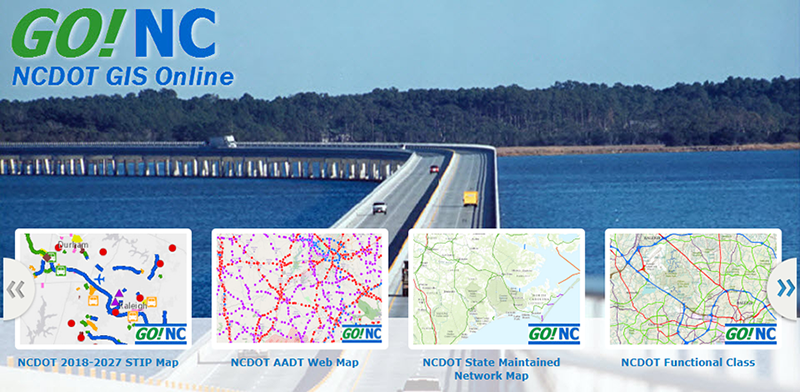
Figure 3. Illustration. GO! NC’s home page.
MDSHA open data application iMAP allows for access to different data sets and different mapping types, and is also built through an ArcGIS online portal (see Figure 4, below). This system is easy to access, and allows public analysis of MDSHA’s data and the creation of custom maps.
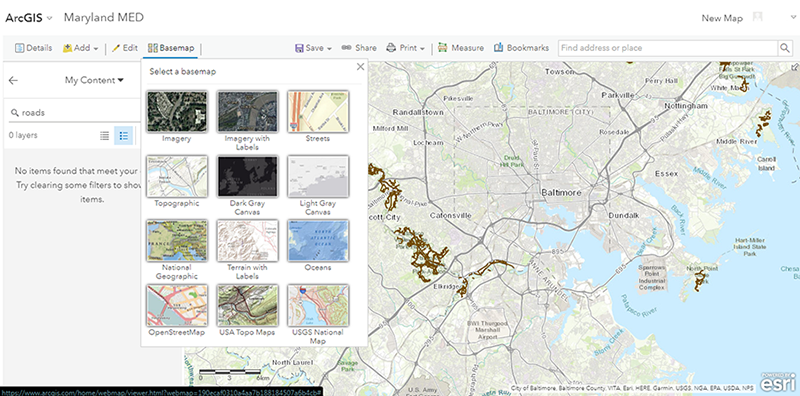
Figure 4. Illustration. View of MDSHA’s online ArcGIS mapping tool.
↑ Back to Top
Managing a Maintenance System
The process of creating and maintaining a maintenance GIS system involves many partners and creating the right conditions within an agency. The participants discussed their journeys toward creating systems like Maintenance-IQ and the struggles they faced in setting up systems, leadership, planning, funding, and the data structures in place that each played a major role in determining success.
Leadership
PennDOT’s decision to move forward with creating the Maintenance-IQ system was influenced not only by need, but also by opportunity. As an agency, PennDOT was particularly well configured for this process—with both GIS and IT divisions specific to the DOT. The separation from other State GIS and IT systems and close working relationships between the groups enhanced their process of building Maintenance-IQ, and allowed an independent assessment of how to run their GIS systems and create data standardization. PennDOT leadership was also very supportive of the system and supported innovation necessary to create a new tool and invest in their data.
For the initial launch, PennDOT marketed the tool widely, and offered in person training events across the State to explain the tool to new users. Currently, over 900 unique users across the State have been in the system, with a particular concentration of business managers and clerical staff. The system is now being used for new applications such as planning snowplowing routes and creating maps for workers.
GDOT described their leadership’s drive for innovation and accountability, two goals that encouraged them to develop a new dashboard reporting tool. By overlaying condition data with projected financial obligation data, GDOT is able to strategically prioritize limited funding and remain accountable (see Figure 5, below). While this dashboard was initially developed for leadership in the Maintenance Division, the model was soon adopted by other departments.
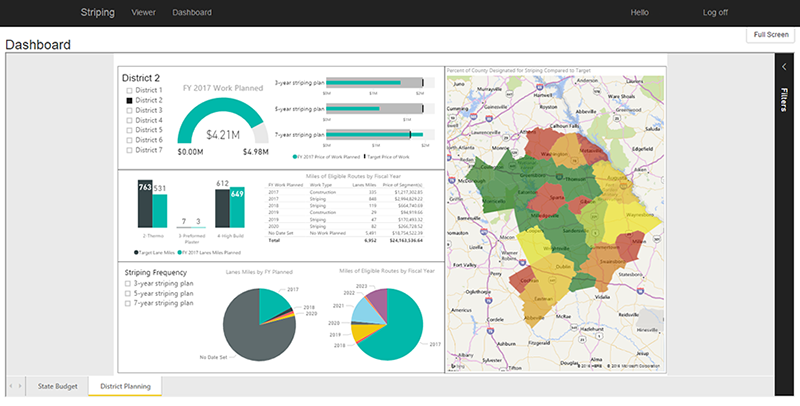
Figure 5. Illustration. Example dashboard from GDOT’s presentation.
Some agencies also noted that when leadership is unsupportive or not involved in crafting a strategy for building a platform, there is less chance of successfully developing one. Aside from funding, the organizational capacity needed and cooperation required to implement a system like PennDOT’s Maintenance-IQ are challenging to obtain if agency leadership is not fully engaged.
Planning
GIS maintenance systems like Maintenance-IQ and GO! NC allow for more informed decision making during planning. Some States use the systems to meet requirements for planning. NCDOT, for example, designed a striping program using GO! NC to calculate the linear distance to be striped and the optimal medium for striping. Using multiple criteria (such as ADT, road type, and plowing routes), GO! NC allowed NCDOT to determine different types of striping needs and allowed for better decision making and strategic planning of striping projects.
Similarly, GDOT use their mapping of maintenance issues to prioritize State routes for maintenance. Determining which roads are used more, and which are most important in their infrastructure network, has helped them to prioritize those roads that need more maintenance attention. The collaborative nature of their mapping project within GDOT brought many new voices to the table to discuss how to prioritize maintenance spending using consistent ranking factors, and allowed the GIS department to use their skills to contribute to planning efforts.
Funding
GIS use for maintenance is also crucial in developing a funding plan for maintenance activities. Multiple States participating in the exchange have developed a system to track maintenance orders or assist in budgeting for maintenance needs. Using a GIS system for maintenance also allows for tracking progress, reporting on tasks, and maintaining accountability. The products reviewed in this peer exchange offered everything from the ability to track the types of contracts being awarded, and the types of businesses being awarded contracts to the ability for a maintenance expert in the field to instantly call up a history of work performed on a road segment.
NCDOT noted that in tracking funding, their GIS programs allowed them to determine needs much more accurately, and to use those numbers when speaking with legislators about funding. It facilitated a conversation between managers and transportation planners, including discussing funding level and project programming. GDOT’s system was designed to track not only the funds being spent, but the types of contractors being used in projects and how many small businesses benefitted from their projects. The system even allowed for a redistribution of work by creating smaller projects and enabling the department to issue more contracts and spread the funding out among many contractors. The overall funding tracked was used in justifying budgets to the contracting office and the Equal Employment Opportunity Commission (EEOC).
Data Structures
Each State in attendance configured their GIS and maintenance tools differently based on their existing databases, available resources, and needs. It’s important to understand the strengths and limitations of the structure in order to develop complex systems like Maintenance-IQ. The difficulties of cleaning and standardizing data across systems and low overall data integrity were large barriers to implementation for some States. Understanding the gaps and quality of their data was the first step PennDOT took in development, an important starting place for any State trying to develop a similar system. Capability maturity models can help State DOTs determine areas they can improve in order to reach a good starting point for implementing programs. FHWA’s Slimgim-T can help in this assessment of readiness, improving data governance and agency capabilities. Slimgim-T is an assessment tool for GIS departments, identifying strengths and weaknesses which may impact the success of future work. Using a capability maturity model can give a good indication of where a department should focus its improvement efforts, and where they may need more training or assistance.
↑ Back to Top
Next Steps
The peer exchange yielded many insights into the process for creating GIS systems for maintenance purposes, and the barriers some States faced cleaning data, integrating it into a single platform, and gaining support for projects like PennDOT’s Maintenance-IQ. Each State has successfully created solutions to their maintenance GIS needs, with additional benefits such as improved financial tracking, open data access for residents, and easier data collection through applications.
What Can FHWA Do?
At the conclusion of the peer exchange, States were asked to identify ways that FHWA’s GIS in Transportation program could help them in their process of developing tools to use GIS for maintenance and other purposes. Ideas put forward included the provision of a GIS-T conference workshop dedicated to maintenance issues and systems, a State survey to identify what other agencies are doing related to maintenance and GIS use, and a follow-up peer exchange to focus more specifically on the process of creating the Maintenance-IQ system. States also discussed the usefulness of working groups on specific topics. Further advertising the successes of systems like these was presented as a potential solution to the challenges agencies faced in obtaining funding and permission to create products like Maintenance-IQ. Demonstrating the value of these programs through a case study might help GIS and Maintenance experts begin a discussion with management about their needs, while showing a path toward improved business processes. A final suggestion was to have a webinar hosted by PennDOT on Maintenance-IQ, to help advertise their success, and also allow a broader audience to see the utility of the tool and the enhanced functionality and user experience it provides.
↑ Back to Top
Appendix A: Peer Exchange Participants and Agenda
Peer Participants
Agenda
| Tuesday, April 10 |
| 8:30 – 8:45 |
Welcome and Introductions – FHWA |
| 8:45 – 9:00 |
Overview of Purpose and Need – FHWA |
| 9:00 – 10:30 |
Maintenance-IQ – PennDOT |
| 10:45 – 12:15 |
Maintenance-IQ cont. – PennDOT |
| 12:15 – 1:30 |
Lunch |
| 1:30 – 2:30 |
Presentation and Discussion – NCDOT |
| 2:45 – 3:45 |
Presentation and Discussion – MDOT |
| 3:45 – 4:00 |
Day 1 Key Points/Wrap-Up – FHWA |
| Wednesday, April 11 |
| 8:30 – 8:45 |
Day 1 Re-cap – FHWA |
| 8:45 – 9:45 |
Presentation and Discussion – GDOT |
| 10:00 – 11:00 |
Presentation and Discussion – ALDOT |
| 11:00 – 11:30 |
Roundtable Discussion: What Can FHWA Do? – All Participants |
| 11:30 - Noon |
Day 2 Key Points/Wrap-Up/Adjourn – FHWA |
↑ Back to Top


