Webinar 27
King County GIS Center and Idaho DOT:
Making a Business Case for GIS Technologies
November 5, 2015
Summary of the Federal Highway Administration’s Quarterly Webinar: Applications of Geospatial Technologies in Transportation
These notes provide a summary of the two presentations discussed during the webinar and detail the question and answer sessions that followed each presentation.
The PowerPoint presentations are available upon request from the webinar speakers, Greg Babinski (Greg.Babinski@kingcounty.gov) and Nicole Hanson (Nicole.Hanson@itd.idaho.gov).
The webinar recording is available at: https://connectdot.connectsolutions.com/p5l0w2gmaqs/.
Presenters
- Greg Babinski, Finance & Marketing Manager
King County GIS Center, King County, WA
Greg.Babinski@kingcounty.gov
- Nicole Hanson, GIS Specialist
Idaho Transportation Department (ITD)
Nicole.Hanson@itd.idaho.gov
Participants
Approximately 54 participants attended the webinar.
Introduction to Presentations
Mark Sarmiento of FHWA thanked participants for joining the webinar. This webinar was the 27th in a quarterly series of FHWA-sponsored webinars. The series deals with the application of geographic information systems (GIS) and other geospatial technologies to transportation. The webinar featured presentations by two agencies:
- Presentation 1: King County GIS Center presented on the return on investment (ROI) of the use of GIS for day-to-day operations.
Question and Answer Session: King County
- Presentation 2: ITD presented on how it understands the value of using GIS to spatially display data with Idaho DOT's IPLAN program.
Question and Answer Session: Idaho Transportation Department
Mark also discussed upcoming reports on Regional Geospatial Collaboration and Return on Investment.
Presentation 1: King County GIS Center
Overview
Greg Babinski of the King County GIS Center provided an overview of the county's efforts to understand the ROI of an investment in GIS software. King County is the most populous county in the State of Washington and includes the cities of Seattle, Redmond, Renton, Bellevue, and other suburbs, as well as the Seattle-Tacoma International Airport. As of the 2010 census, the county's population was 1,931,249.
The GIS Center manages the King County Geographic Information System (KCGIS), a cooperative, multi-department, enterprise GIS. The GIS Center provides GIS leadership, coordination, infrastructure, and services to meet the business needs of customers and clients within King County government and in a number of city agencies. It has an annual budget of $9 million.
Enterprise GIS Development
In 1992, King County began to invest in an enterprise GIS suite for use by multiple county agencies. King County made the case that, assuming it could buy or develop core infrastructure with hardware, software, and staff to support end users, enterprise GIS would support a number of key business processes—e.g., permitting, public safety applications, real estate research, and customer relationship management (CRM).
To justify the cost and to understand the value such an investment would generate for the county, King County contracted with a private firm, PlanGraphics, to conduct a benefit-cost analysis in 1992. The analysis found:
- Over 10 years, the total cost of an enterprise GIS, including all hardware, software, staff, application development and other costs, would be $22.5 million (net present value, 1992).
- The potential suite could connect up to 126 applications, based on the needs of different county and local agencies.
- Future benefits in time savings, new revenue sources, and other value over the same 10-year period would total $33.6 million, in 1992 dollars.
- This would equal a payback period of 7.5 years, which is when benefits would start to exceed costs and create a positive financial situation.
Based on this analysis, the King County Council funded a $6.8 million scope in 1993, to cover capital investments from 1993-1997. Over that period, 12 county departments began to integrate GIS tools into their day-to-day operations. To support the growing user base, GIS support and infrastructure were consolidated in 2002, at which time the King County GIS Center was formally established.
In 2004, the county committee tasked the GIS Center with a review of what GIS services had so far been delivered, based on the original scope. Of the 126 applications identified in 1992, only 15% had been developed at that time, due in large part to significant data deficiencies. There were, however, 330 unique desktop users.
Methodology for the ROI of GIS
By 2010, the number of desktop users of the GIS Center's enterprise GIS solution reached 480 individual users, with over 100,000 annual internal user sessions. By that time, 35 departments were using GIS as part of their operations practices. Despite the impressive growth in use, King County had not stopped to investigate whether it had yet achieved the payback and expected ROI that was forecast in 1992.
Realizing that other agencies, including multiple agencies that participate in the Urban and Regional Information Systems Association (URISA), were interested in an approach to justify their own spending on GIS, the State of Oregon and King County decided to conduct a joint study on the ROI of GIS using comprehensive financial analysis methods. After issuing an RFP, Oregon and King County selected Richard O. Zerbe, a professor at the University of Washington School of Public Affairs and founder of the Benefit-Cost Analysis Center at the University of Washington, to conduct the study.
The scope for this updated study into the ROI of enterprise GIS solutions included a literature review (for background on GIS tools and applications), 30 qualitative interviews with key users in both the State of Oregon and King County, a quantitative survey to 200 GIS users in both agencies, a financial ROI analysis, and a revised survey instrument for continued surveys. Professor Zerbe and a team of researchers used a ‘with or without’ research design, investigating the question, What would have happened had GIS not been implemented?
The study analyzed how GIS had altered agency output levels (per full time employee [FTE]), in three stages:
- Face-to-face interviews with agency heads and key employees
- Online surveys of GIS users, including operational employees and managers
- Identification and quantification of benefits based on the survey
To quantify the costs and benefits of implementing enterprise GIS, the study used a theoretical basis using two separate estimates of benefits. As illustrated in the figure below, marginal benefits vary based on the number of users (or ‘quantity of units,’ ranging from Q1 to Q2 below) accessing GIS and on the price of each unit (which declines as the number of users increases, as shown by the GIS Demand Curve). The net benefits may include new demand generated by increased usage (e.g. new applications, easier access, etc.) or may be limited to the demand identified at the start of the investment in GIS. (New demand is shown in dark turquoise below, while starting demand is shown in turquoise.)
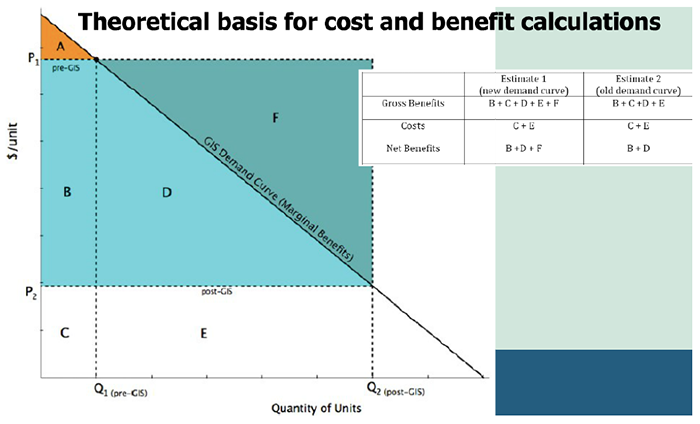
Figure 1. Theoretical basis for cost and benefit calculations, as developed by Zerbe and Associates.
Findings and Next Steps
The study found that capital, operations and maintenance, ng end-user staff costs were over $200 million over the 13-year analysis period in King County for the study (Table 1).
Table 1. Annual and total costs over the study period for King County GIS Center
| Year |
Capitol
Costs |
GIS PM
Office Costs |
KCGIS
Center
O&M Costs |
Agency GIS
Unit Costs |
Agency GIS
End-User
Staff Costs |
Annual Total
GIS Costs |
| 1991 |
$100,000 |
$104,000 |
|
|
$6,000 |
$210,000 |
| 1992 |
$100,000 |
$104,000 |
|
|
$6,000 |
$210,000 |
| 1993 |
$729,667 |
$104,000 |
|
|
$6,000 |
$839,667 |
| 1994 |
$2,173,667 |
$416,000 |
|
$400,000 |
|
$2,989,667 |
| 1995 |
$3,756,667 |
$416,000 |
|
$5,000,000 |
|
$4,672,667 |
| 1996 |
$2,512,000 |
|
$1,373,000 |
$600,000 |
|
$4,485,000 |
| 1997 |
$528,000 |
|
$1,760,000 |
$8,204,352 |
$703,300 |
$11,195,652 |
| 1998 |
$98,500 |
|
$1,477,000 |
$8,204,352 |
$2,003,300 |
$11,783,152 |
| 1999 |
$207,833 |
|
$1,099,000 |
$8,204,352 |
$2,919,800 |
$12,430,985 |
| 2000 |
$182,833 |
|
$1,134,000 |
$8,362,432 |
$2,926,300 |
$12,605,565 |
| 2001 |
$182,833 |
|
$1,077,000 |
$8,362,432 |
$2,926,300 |
$12,548,565 |
| 2002 |
|
|
$2,430,000 |
$5,675,072 |
$3,153,500 |
$11,258,222 |
| 2003 |
|
|
$2,777,000 |
$4,483,149 |
$4,961,720 |
$12,221,869 |
| 2004 |
|
|
$3,082,000 |
$4,479,987 |
$7,323,206 |
$14,885,194 |
| 2005 |
|
|
$3,148,000 |
$4,641,229 |
$6,865,133 |
$14,654,362 |
| 2006 |
|
|
$3,470,000 |
$4,584,320 |
$6,702,160 |
$14,756,480 |
| 2007 |
|
|
$4,058,000 |
$3,944,096 |
$6,869,797 |
$14,871,893 |
| 2008 |
|
|
$4,107,000 |
$4,339,296 |
$6.892,954 |
$15,339,250 |
| 2009 |
|
|
$3,884,000 |
$4,315,584 |
$6,578,260 |
$14,777,844 |
| 2010 |
|
|
$4,269,000 |
$3,975,712 |
$6,396,945 |
$14,641,657 |
| Total |
$10,572,000 |
$1,144,000 |
$39,145,000 |
$83,276,365 |
$67,240,325 |
$201,377,690 |
The GIS-ROI study found that, for the King County GIS Center, enterprise GIS generated a net benefit of over $775 million over 18 years, with benefits of between $87 million and $180 million in the last year of the study. This included a net benefit of approximately $19 million to the county's transportation department in 2010.
King County has subsequently focused on continued investment in GIS, substantially increasing its focus on new applications and an increasing user base. Its biennial budget is currently $14.5 million and it supports 40 agencies across the county, including county departments and local agencies. In 2013, it identified 4,600 discreet users within King County.
While the results are impressive, the GIS Center has struggled to understand the significance of these results. Very few similarly-sized county agencies or transportation departments have investigated the ROI of their own GIS investments, which gives the county little against which to benchmark its spending and ROI.
In partnership with URISA and the URISA GIS Management Institute, Greg Babinski and the GIS Center have therefore developed tools to support awareness around ROI methodologies, including a GIS competency tool—the GIS Capability Maturity Model. Likewise, URISA will be releasing a metric survey at the end of 2015, which will survey agencies of varying sizes as to their GIS capabilities, maturity, key metrics, and relevant ROI calculations. The hope is that 30 or more medium sized cities or counties will complete the survey, to provide more concrete data on the returns from GIS investments.
Question and Answer Session: King County
Could you explain or elaborate on what you mean by mature management for GIS?
The GIS Capability Maturity Model (CMM) by URISA focuses on the key capabilities of GIS and of management process maturity. I think the level of management process maturity of a GIS operation correlates with the effectiveness and ROI of the GIS. For example, King County GIS performed a self-assessment against the CMM. We found that we had a middle-high rating on the backup and restoring data component. Earlier this year, though, we had a crypto-virus attack that required us to shut down our GIS and held ransom our data. It took us longer than it should have to restore data and to operate at a safe state. So the maturity model is helping us to have a stronger conversation with leadership and to identify where we need further investment, particularly as it relates to security.
You mentioned the GIS CMM. Can you describe how you assessed King County GIS using the model?
I will say that initially we thought managers would overrate themselves. But there's really no value in overrating; a good manager should be self-critical. When we went through the CMM process, we were able to hone in on a group understanding of how we were performing and areas that we needed to improve or support each other, largely because we were so honest in our assessment.
What data themes do you feel are essential for success? Are Federal Geospatial Data Committee (FGDC) Core Framework themes the ideal foundation to strive for?
The Geospatial Management Competency Model and the CMM from URISA both have answers. On the modeling capability side, CMM asks organizations to rate their availability and maintenance of the FGDC Core Framework themes. There's a second set of themes on business data. Not every agency has the same business case, so those key business-related data themes will vary agency-to-agency. In the CMM, an agency needs to identify at least five and no more than ten business themes.
So for example for King County, utility data is not that important for us. We have a wastewater treatment division, but we don't have utility lines. But things like natural resources management and LIDAR data are more important for us. So we are able to respond to those themes and identify what is important, from a business standpoint.
The GIS groups in most agencies have very limited resources, as you know. How do you encourage management to quantify the work that you do and the value that you're bringing to the agency?
Within King County, we started the process when we began asking questions about ROI. And it's very easy to be complacent and keep doing what we do, but it's very difficult to go beyond one conceptual type of value.
The CMM, though, is really designed to create a mechanism that organizations can use to self-assess. It generally will take at least 8 hours to do the assessment, but it creates a baseline and a mechanism so that you can initiate a discussion with decision-makers. Over time, as more agencies and State DOTs hopefully take the self-assessment, they will be able to compare themselves against other agencies in their peer group or of similar type and size. Participants will then get a report on their performance compared to peers, which they will be able to customize and design, based on their focus. If we can add an ROI component to show ROI from similar organizations and compare to performance against the CMM, this would allow GIS managers to come up with statistically valid correlations about how different investments will impact the ROI, which will help give more of a scientific basis to GIS management.
Back to top
Presentation 2: Idaho Transportation Department (ITD)
Nicole Hanson, a member of ITD's GIS team, reviewed some initial findings from ITD on the intellectual value the agency is getting from its ArcGIS Online (AGOL) solution, IPLAN.
Background
When Nicole started with ITD in 2012, most GIS data was stored with individual divisions and departments, limiting its accessibility by users from other parts of the organization. The GIS team was used to significant back-and-forth to get different data sets and create individual maps for each information request or question they received. The GIS team therefore prepared a recommendation to move forward with a centralized solution, which resulted in the development of IPLAN.
Development of IPLAN
ITD's Planning Office worked with a contractor to develop data and build the first version of IPLAN, by collecting and manipulating data from different business units to create a stagnant data set. Unfortunately, the development cycle was relatively long and by the time IPLAN launched throughout ITD, most of the available data was outdated. The contractor was primarily responsible for data collection and processing, and while they did provide a data transfer and report after the project was complete, the data was not easily delineated.
Following the initial launch, use of IPLAN remained relatively limited. In 2014, responsibility for IPLAN was transferred from the planning office to the GIS team, which began to rebuild the data using structures that would be easier to update. In particular, the team bid out to contractors to create “Extract, Transform and Load” (ETL) processes for each business unit and to standardize data harvesting. The GIS office also went through a process of redesigning IPLAN's interface, including creating a more visual landing page and updating icons to reflect a more current aesthetic.
Currently, in part due to the improved ETLs, IPLAN uses an active updating process with weekly data updates and refreshes. Different business units are starting to see new benefits to using IPLAN as it has improved. Some benefits of the new service have included:
- Multiple business units use IPLAN for data collection, reducing data collection time for HPMS data, for example, by 33% compared to before IPLAN's launch.
- Idaho Fish and Game has started to share its own data with ITD using IPLAN, enabling improved collaboration on environmental projects.
- Departments are increasingly choosing to store their data directly in IPLAN, rather than in Excel or an Access database.
- Working with ID Fish and Game to share data and maps makes collaboration much easier.
IPLAN Demo
Nicole demonstrated one use of IPLAN and AGOL's StoryMap application for monitoring historical markers along state highways, the Interstate, and the National Highway System in Idaho. ITD's Historical Commission had asked for a listing of each of the historical markers along those highways, but since data on the highways was already available in IPLAN, Nicole suggested creating a StoryMap with the data. StoryMaps allow users to combine map information with narrative text in the form of custom, dedicated animations or webpages.
ITD initially prepared a map of historical markers on State Route 20, but since creating their first StoryMap, the GIS team has been asked to continue to collect photos and marker information on the entire highway network.
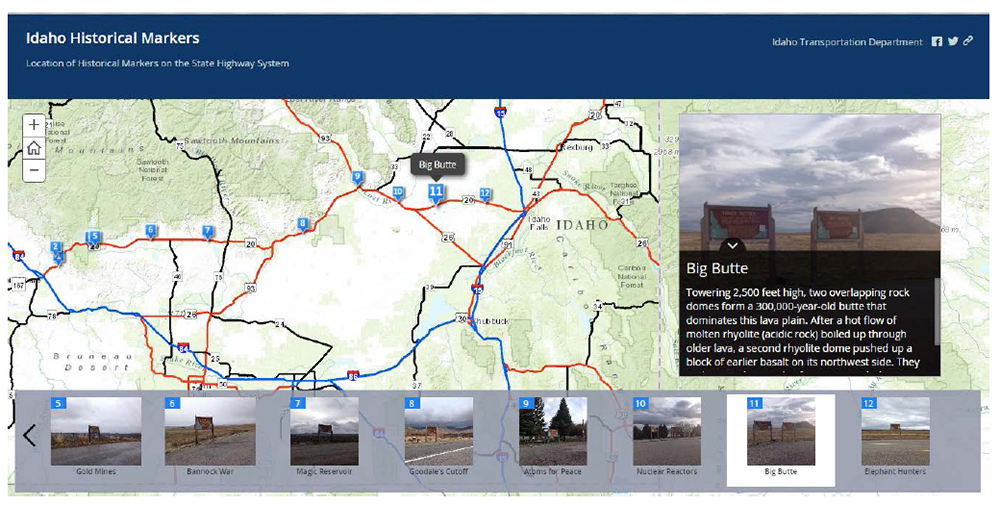
Figure 2. Idaho historical markers map, using the StoryMap feature in IPLAN.
Thanks to visualizations like the historical markers, groups within ITD and throughout Idaho are starting to value IPLAN as a means for collecting, storing, and visualizing data on the transportation network. Over time, the GIS team anticipates additional time savings and improved efficiency in information sharing, as data becomes less siloed and more consistent and interoperable, via the IPLAN interface.
Question and Answer Session: Idaho Transportation Department
How challenging was it to inherit an application that was developed by a different organization and to adapt it for your purposes?
It was pretty challenging. Starting out, I did not know much about the AGOL environment. So starting out, watching ESRI webinars and taking advantage of their free training was valuable. The GIS team, as a whole, worked our way through it gradually, trying to get more information as we needed. In addition, the launch kit was a huge help from ESRI—it made it much easier on us and ultimately made it easier for the public to view our data
How many people are in your office/were involved in working on IPLAN?
The GIS team, here at the central office, is three people, as well as a manager, here at headquarters. We have six district analysts who don't report to our manager directly, since it's a decentralized structure. District analysts focus more on specific regions and areas, and we work with them to establish a statewide schema so that we can mesh data together.
Did you consider using Data Driven Maps (ArcMap) for the historic marker atlas?
We did not, but it is something we will look into.
Is the historic marker story map available on your IPLAN website?
Yes, it is available on the IPLAN homepage.
When did you get IPLAN in place? How long was the process?
It was started about 3 years ago as initial development. Ownership was brought to the GIS group in 2014.
What are ITD's future plans for IPLAN?
We are still exploring additional features and working through bugs as we find them. We still haven't quite determined the best way to sell it to management and to the public. Our manager has been holding meetings with management and business units to build greater visibility and more engagement around IPLAN. Over time we are seeing the visibility increase, and we hope to continue to improve visibility.
How was IPLAN initially funded?
I don't exactly know. I know the maintenance is wrapped into our general agreement with ESRI, but I'm not sure about how it was initially funded?
Have you been involved with AASHTO's efforts using AGOL?
I have heard very little about that project, aside from the presentation they gave at the URISA conference.
Are you planning on doing a ROI analysis for one of your new applications? Now is the time to do it since you have the current way of doing it versus ArcGIS Online Apps.
In the future, we may do more of an ROI analysis, but there is currently no plan in place. A lot of this is still very new for us, so we're trying to figure out the best way to go. We're establishing contracts with ESRI for more help from them. So our main focus is on making sure the IPLAN site works and is consistently updated.
How many page views does IPLAN get? Is it popular with the public?
We're working with ESRI to refine the data, e.g., to determine unique views to different pages, maps, etc. It does seem to be pretty popular. For example, we often receive calls when the homepage is updated or when new data is incorporated. The site is updated weekly; we're determining whether we will need to update more.
You spoke about silos for data, are those silos starting to break down?
Yes, the ETLs helped a lot. We have been able to tap into different disciplines and draw out their information, thanks in large part to the improved ETLS. ITD is finding that GIS is really the only system that can go into other databases and systems and show everything, all on one map. For example, our asset management system does not have an ETL in place to tap into bridge data. But with the IPLAN website, asset management has been able to tap into the bridge data. We're finding ways of opening data and increasing sharing between disciplines and groups. We're also finding ways to open data to outside agencies, so that those agencies can go and download data without having to call or email us each time.
Back to top

