GIS/Right-of-Way Peer Exchange Summary Report
Peer Exchange in Denver, CO
March 6th and 7th, 2023
Participating Peer Agencies:
Colorado Department of Transportation
Minnesota Department of Transportation
Utah Department of Transportation
Virginia Department of Transportation
Vermont Agency of Transportation
Wisconsin Department of Transportation

Prepared for:
Office of Planning
Office of Real Estate Services
Federal Highway Administration
U.S. Department of Transportation
Table of Contents
Return to top
Purpose
The Federal Highway Administration’s (FHWA) Geographic Information System (GIS) in Transportation program sponsored a two-day peer exchange in March 2023 to convene practitioners of GIS applications to discuss and learn about how State Departments of Transportation (DOTs) are implementing GIS in right of way (ROW) planning and management. The peer exchange took place in Denver, Colorado, at Colorado DOT’s (CDOT) headquarters.
Participating peer agencies included CDOT, Minnesota DOT (MnDOT), Utah DOT (UDOT), Virginia DOT (VDOT), Vermont Agency of Transportation (VTrans), and Wisconsin DOT (WisDOT). Also in attendance were representatives from the FHWA Division Offices of Colorado and Wisconsin. The peer exchange included a series of presentations from all the peer agencies, as well as a presentation from the FHWA Office of Planning. Each day of the peer exchange also featured a roundtable discussion. The exchange concluded with a discussion of next steps that both the State DOTs and FHWA can take to facilitate the continuation of collaborative spaces for ROW planners across State DOTs. The United States DOT (USDOT) John A. Volpe National Transportation Systems Center (Volpe Center) supported FHWA to facilitate the peer exchange. Volpe also developed this report that provides a summary of the peer exchange, background and summaries of each presentation, themes, roundtable discussions, and next steps for participants.
Return to top
Background
FHWA initially recognized the need for a peer exchange on this topic based on interest from State DOTs through the GIS for Transportation (GIS-T) 2022 Survey administered by the American Association of State Highway and Transportation Officials (AASHTO). This peer exchange is also a follow-up to a previous event held in Nashville, Tennessee, in February 2020. That February 2020 peer exchange focused on preliminary transportation project ROW costs and highlighted a need for ROW specialists and transportation planners to collaborate more effectively. In particular, discussions centered on how ROW activities could benefit from GIS. The FHWA-sponsored peer exchange described in this report was an effort to address that question.
Return to Table of Contents
Summaries of Peer Presentations
Minnesota DOT
MnDOT’s approach to ROW is project driven, with both the district and central offices involved in the process. Each of MnDOT’s eight districts is responsible for administrating its own land transactions. The MnDOT central office creates a final ROW map for each project. This is a summary of all ROW and survey records, including an identification of landowners, land acquired, and level of interest. It also identifies where official documents related to a project or transaction can be found. The map contains alignment information, public service information, and any other information related to the acquisition of parcels.
MnDOT’s paper ROW maps date back to the 1920s and these older maps are leveraged to review and update the digitized maps. The map medium has since changed from paper maps to creating TIF, CAD, and PDF files (Figure 1). In the 1990s, MnDOT started creating raster TIF images of the ROW maps. PDFs are sometimes a limitation because the scale often gets distorted for larger maps, considering some can be up to 200+ inches wide.
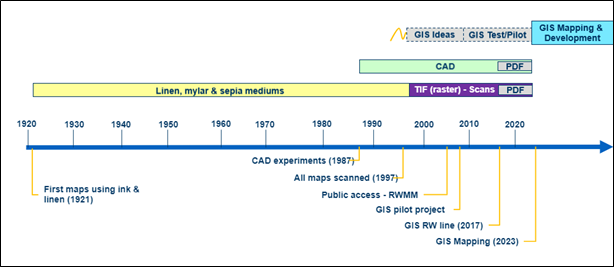
Figure 1. Timeline of ROW mapping efforts at MnDOT.
Source: Minnesota DOT
REALMS Viewer
In 2010, MnDOT’s Real Estate and Land Management System (REALMS) Viewer was released with the goal of having a place to document and store parcel data and ROW lines in a GIS format. When creating a data entry in REALMS, a complete legal description of a parcel was required, including proof of conversation with the landowner and whether an offer had been made. MnDOT noted that converting each element of the original ROW map into GIS was more difficult than originally anticipated. Although REALMS was meant to be used throughout the entire acquisition process, it was ultimately not used to its full potential because users defaulted to not using the system at all when complete data could not be provided. MnDOT also relied on consultants to create the data because the agency did not have in-house expertise to manage the system at that time.
ROW Mapping and Monitoring
Implementation of REALMS led to the successful creation of parcel data. In 2017, MnDOT began implementing GIS into ROW line development. The GIS/ROW team now works directly with regional offices to collect a complete spatial representation of the parcels. District-generated spatial data includes property maps, sketches, and ROW lines. GIS/ROW staff are working on implementing data standards and displaying different types of acquisition data.
The ROW Mapping and Monitoring Map viewer (Figure 2) is a public-facing web mapping application used for maps and plats. The viewer includes about 2,600 TIF files and 500 CAD files that provide nearly complete statewide coverage. There are only a few data gaps across an estimated 256,000 acres of land owned by MnDOT.
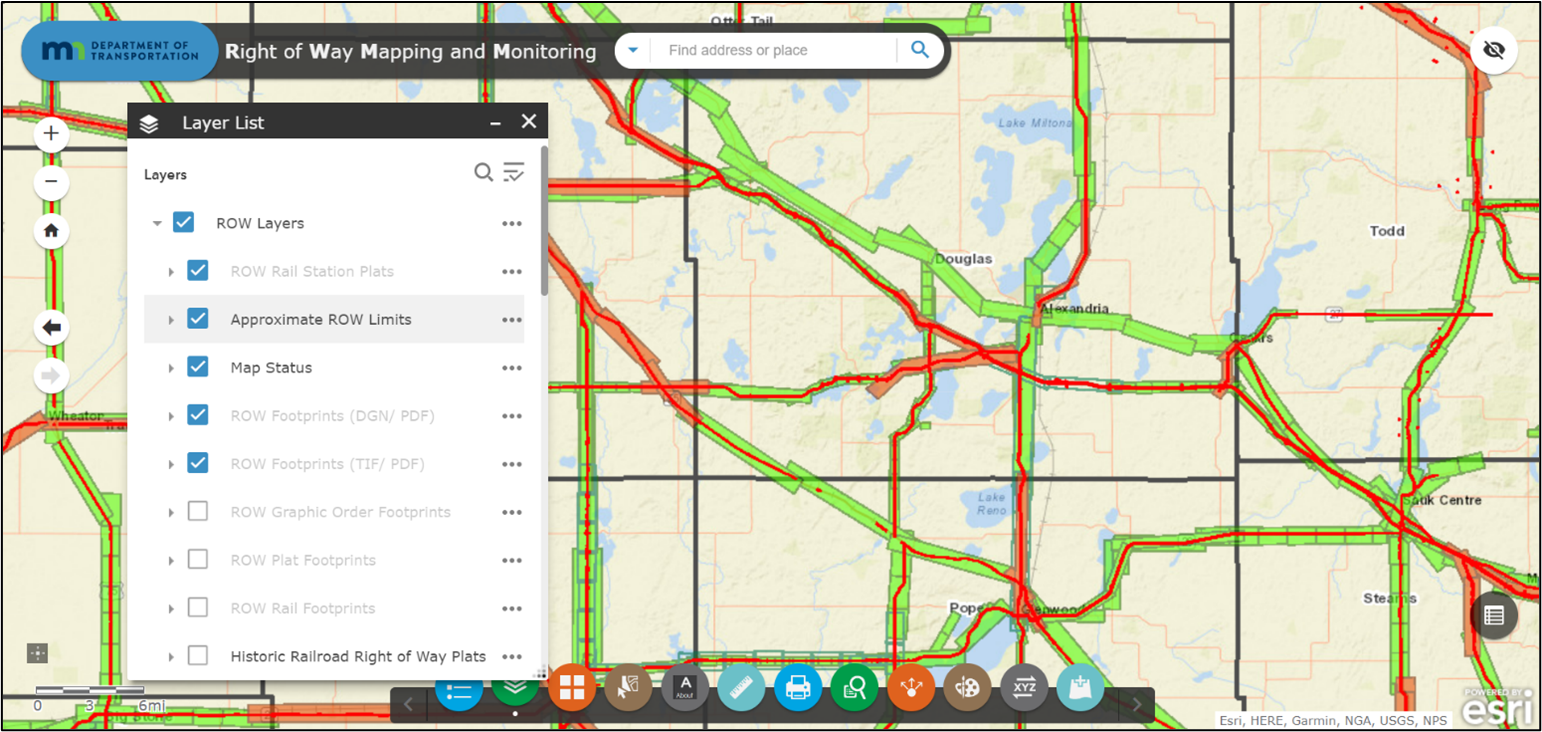
Figure 2. The ROW Mapping and Monitoring application is hosted on Esri’s ArcGIS Online.
Source: Minnesota DOT
Data Sharing
In 2009, the State of Minnesota passed a statute specifically addressing geospatial data-sharing standards, which built on previous data management practices. This statute defined spatial data and how to share data among government organizations through coordination between various agencies. The statute also resulted in the creation of MnGEO, a geospatial advisory council composed of representatives across various State agencies. In 2010, GeoCommons was created. This is used specifically for raw data-sharing across 18 data categories. MnDOT uses an internal-use only data viewer application called Georilla, which runs on an open-source software called GeoMoose and includes a basic toolkit for drawing, measuring, etc. MnGEO/GEOCommons are used to set data management standards.
The GIS/ROW staff are currently working to migrate datasets into ArcGIS Online (AGOL), specifically into the MnDOT AGOL Portal. The MnGeo Portal, currently in testing phase, is a focused effort to create parcel polygons and maintain the current ROW lines. The portal also sets management standards and determines the most accurate version of a multi-copy dataset. GIS mapping techniques allow for increased access to documents and data with a heavy emphasis on parcel data. The MnGeo Portal team would like to make the portal more user friendly, such as allowing a user to add or remove layers with other options to customize viewing. Another goal is to improve metadata transparency for the public, utility companies, and other users. MnDOT also reported that there is a need to improve the portal’s data presentation to make it easier for users to read and identify records/parcels.
The final ROW line is MnDOT’s attempt to geospatially represent ROW interests statewide. There are many different features that can be associated with each parcel, including the ROW line, raster ROW map, alignment, and ownership type (including in fee, easement, or road order). The MnGeo Portal team must still determine how data in the portal will be displayed—whether grouped by county level or another classification. Currently, the ROW line data are stored in a file geodatabase.
Challenges
MnDOT has faced challenges concerning funding and staffing resources. It is difficult to get support to digitize ROW processes due to the agency’s long history with documenting ROW on paper. There are six staff members, including GIS and CAD specialists, who currently work on ROW GIS processing although staff must also balance among other projects. The team also needs the MnDOT GIS Group’s approval make changes to and publish data to the MnGeo Portal. While staff are currently using both ArcMap and ArcGIS Pro, the agency seeks to have all data moved into ArcGIS Pro by 2024.
Producing and utilizing the ROW maps is also challenging. The maps can be difficult to read since they are typically developed for internal agency use and do not have a legend or a scale. There is limited space on any map to document/demonstrate the entire history and present conditions associated with a parcel. It is time consuming to create the maps while following a blend of past and current data standards. However, MnDOT noted that the biggest challenge is identifying which version of a map is the most current and accurate version.
Wisconsin DOT
WisDOT is currently piloting the use of an Esri web mapping application to view its ROW data. This is an internal application used specifically for mapping scenic easements. The agency’s primary workflow for servicing this map viewer includes using a spreadsheet that stores some parcel information and links to county portals/websites where GIS data and further information are stored. Each of Wisconsin’s 72 counties has its own spatial data portal, which can be difficult and time consuming to navigate. WisDOT’s goal is to use GIS to extract ROW lines from old plat PDFs and create spatial lines and polygons representing the ROW boundaries and parcels. A consultant will be helping with this effort, and the project will eventually expand to cover the entire State. The team plans to have CAD files for each parcel.
WisDOT plans to incorporate GIS throughout the entire process of real estate acquisitions, from determining the project scope to undergoing appraisal review, cost estimation, review of property ownership, and evaluating tax amounts. The biggest challenge is funding. WisDOT’s real estate team is seeking more resources to hire permanent staff and consultants. WisDOT staff raised concerns about collecting utility data on the ROW parcels, specifically in terms of where to house this data. Funding is needed to migrate to use of a cloud-based system.
WisDOT’s GIS professionals are considered part of the organization’s innovation unit, which is still in the process of being fully formed, while the real estate team is located within a separate unit. WisDOT’s planned path forward for ROW GIS work is to use a combination of in-house staff and consultants. Each county has its own geospatial data portal, which requires the WisDOT team to find and learn how to use these individual websites and applications as well as parse out ROW data (Figure 3).
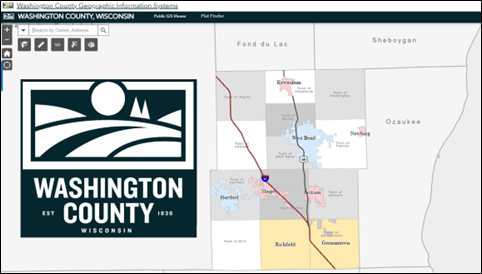
Figure 3. GIS Portal for Washington County, Wisconsin.
Source: Wisconsin DOT
Virginia DOT
Currently, VDOT has a geospatial open data portal with a wide variety of datasets, but does not have a published ROW dataset. VDOT’s ROW and utilities division started building a ROW base layer through support from a consultant, with the goal of combining every individual tax lot into the layer. The data are currently being converted from MicroStation to ArcGIS layers. VDOT maintains nearly 100% of all roads and road access points in the state. VDOT-owned drones are used to obtain aerial imagery of the roads.
VDOT’s data is hosted for internal use on Virginia Roads. This web application, which was built in-house (Figure 4), shows project boundaries with limits for each data type. Data includes survey, mobile LiDAR, and SUE. The GIS team wants to build an application like Virginia Roads specifically for ROW (Figure 5).
Historically, VDOT bought land directly using ROW plan sheets. In 2012, work began to import shapes from ROW survey grade plan sheets found in the State Highway Planbook to ArcGIS. Property owner information and surveying information are stored in an Excel spreadsheet. The software currently being used to import the shapes from the ROW plan sheets includes Projectwise, Orbit GT, and ArcGIS. VDOT’s ROW/GIS staff are working to create a “digital twin” of ROW two-dimensional elements that three-dimensional information can be added to, specifically the parcels and easements. VDOT also plans to collect 1.5TB of LiDAR data daily for ROW purposes. VDOT’s greatest ROW need is to standardize processes across the State; there are large volumes of old data with inconsistencies across various divisions. It would be useful for smaller offices to make changes directly to the ROW/easements data as well as create a centralized ROW department, inclusive of easements, to set data management standards.
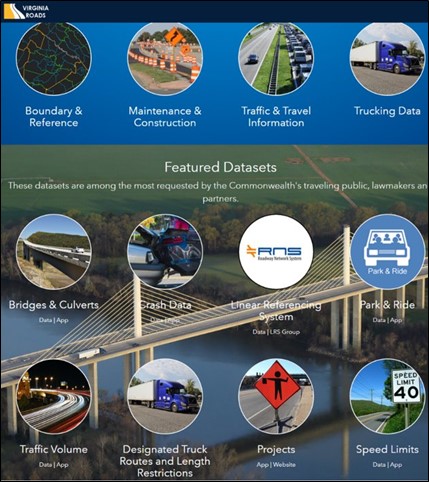
Figure 4. Screenshot of Data Categories and Featured Datasets on Virginia Roads.
Source: Virginia DOT
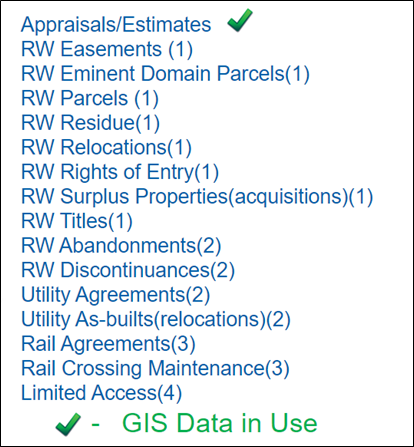
Figure 5. ROW data-usable GIS data for Appraisals and Estimates.
Source: Virginia DOT
Utah DOT
UDOT’s central GIS group function as administrators of UPLAN, Utah’s statewide GIS open data portal. Each division is responsible for managing its own datasets; there are two GIS staff who manage UDOT’s ROW data (one consultant also assisted in the initial digitalization). UDOT has been using GIS in ROW processes since 2015. Since this time, UDOT’s ROW division has developed a property inventory tracking system that uses GIS to manage parcels, as well as data pertaining to water rights, surplus properties, auction maps, permitting for access, encroachments, and special events. The parcel inventory also includes a layer of polygons representing UDOT-owned parcels. This layer does not include any descriptive attributes.
The typical method that UDOT uses to add parcels to the dataset is finding and drawing in the metes/bounds of the property based on a legal description as found in the deed. In addition, UDOT georeferences plan sheets and then draws in parcels from that specific area. Parcels are uploaded from CAD files, which are then added to the system digital delivery system (Figure 6). This process is now required for all new projects. Parcels are identified as a number within a circle drawn onto a plan sheet.
UDOT’s future plans include developing an artificial intelligence model that will “comb through” plan sheets and find circles with identified parcels. The model will then extract the parcel numbers from those plan sheets and put them into a searchable database. This will allow staff to find and compare parcels that are missing from the inventory. UDOT’s ROW staff have nearly completed this application and will then query the collected data. UDOT’s ROW staff also want to use drones to capture current aerial photography of surplus property. The agency noted that this will be especially useful in marketing and selling surplus land.
UDOT also has an Esri ArcGIS web mapping application, the UDOT ROW Parcel Search Application (Figure 7). Using this application, a user can click on a parcel to show attributes such as tax identification number and property type (to show what the property was before and after it was purchased). The application also distinguishes between surplus parcels, surplus approved, excess approved, and corridor preservation (reimbursed and not reimbursed). It also includes access control information to define roads as fully controlled (State roads), partially controlled, or uncontrolled.
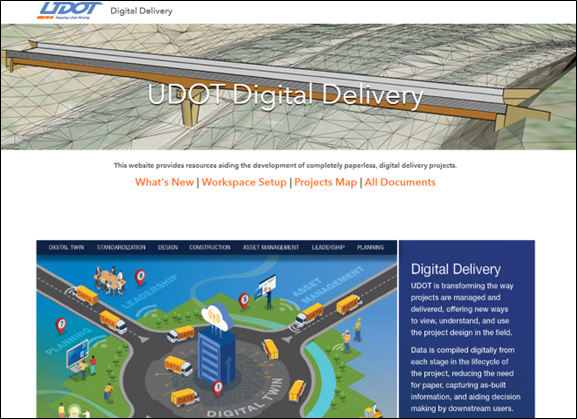
Figure 6. UDOT’s Digital Delivery website. More information can be found on the UDOT Digital Twin Strategic Plan.
Source: Utah DOT
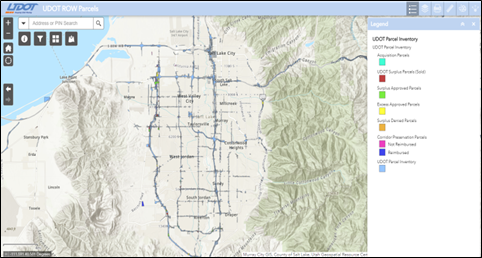
Figure 7. UDOT’s ROW Parcels. This web mapping application can be accessed by a public user via UPlan, Utah’s open geospatial data portal.
Source: Utah DOT
Colorado DOT
CDOT defines real property as any land and any improvements to the land, including temporary and permanent easements, air or access rights, access control, purchase options, and other contractual rights in land. ROW is real property intended for the construction, operation, maintenance, or mitigation of a transportation or related facility. The OIT GIS team produces a statewide parcel dataset that is public facing and used for verification (Figure 8). There are some areas of the highway where there are no existing data. These areas need to be surveyed to integrate them into the statewide parcel dataset.
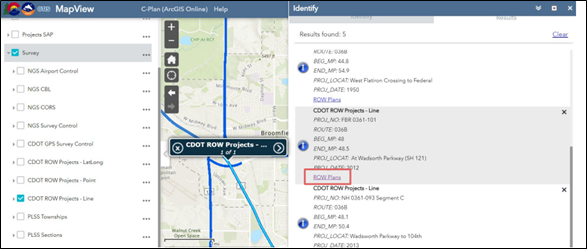
Figure 8. Public version of the ROW project archive. ROW files here link to authoritative documents.
Source: Colorado DOT
In 2015, a consultant was hired to create a mapping-grade GIS representation (not survey grade) of CDOT’s current real property data. This was done by identifying all available ROW plan documents, cataloging them and prioritizing by location, currency, and quality, and then creating spatial data for the documents in order of priority. In 2020, once this project was completed, a lifecycle plan was implemented to maintain the data. The lifecycle plan is divided into three stages: procure source documents, GIS research, and geospatial data processing (Figure 9). During GIS processing, CAD (Microstation DGN) files can be converted to file geodatabase feature classes using CDOT’s custom CAD to GIS Conversion tool developed by the consultant, or georeferenced PDF plans in ArcGIS Pro to align with aerial imagery. Then CDOT can manually digitize the real property feature. Updates are made using ArcGIS Pro in a versioned enterprise SQL geodatabase which allows for multiple editors. Before edits are published, some quality assurance and verification checks are performed. Currently, CDOT staff are migrating most databases from on-prem servers to cloud-based Amazon Web Services (AWS). There is a trend to move towards using OnBase for document storage as well as transitioning from FME to ORD.
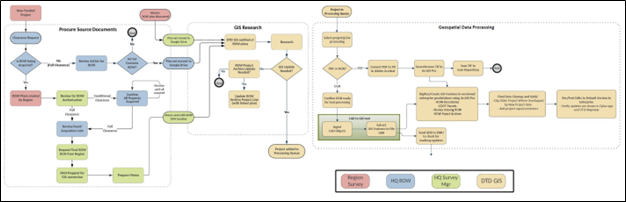
Figure 9. CDOT workflow for converting ROW data to geospatial format.
Source: Colorado DOT
CDOT has an internal Esri web mapping application called the Real Property Data Viewer. This application is not available to the public due to CDOT’s limited confidence in the accuracy of the data. The application includes real property layers: routes missing ROW, route project archive, access control lines, leases, easements, parcels, general ledgers, etc. A user can click on lease polygons to view information about that parcel. Attributes include source processing method, source file, and a path link to archive folders with authoritative plan sheets. There is a legend available, highlighting various ROW, excess, and easement types. Additional layers include ROW Centerlines, PLSS, and mile-points (Figure 10).
Successful applications of using GIS ROW data include the CDOT Real Property Data Viewer, scoping potential corridors for a front range passenger rail line, scoping potential areas for solar development in the ROW, and scoping potential electric vehicle charging locations. Property management use cases include Title VI investigations, maintenance of vacant properties, and selling unused parcels. In addition, Esri has written a case study article on the full extent of GIS in ROW applications at CDOT.
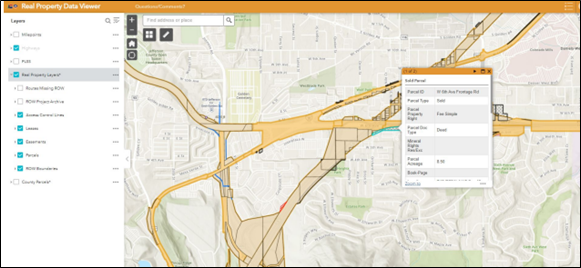
Figure 10. CDOT Real Property Data Viewer, hosted by Esri’s ArcGIS Online.
Source: Colorado DOT
Vermont Agency of Transportation
In 1994, the Vermont Center for Geographic Information (VCGI) was created with the goal to manage a comprehensive strategy for the use of GIS across Vermont. VCGI operated as a non-profit until it was absorbed into the Agency of Digital Services in Vermont’s State government. Two goals included managing the open geodata portal and setting standards for best practices in data management (Figure 11).
At VTRANS, GIS ROW staff are located within the Highway Division/Project Delivery Bureau/ROW/Utilities/Survey GIS Team. All ROW projects go through a GIS team that is based at the VTRANS central office. A State statute passed in 2015 set up a framework for a statewide property parcel layer as an Esri web application. This statute established a mechanism to maintain and update the layer, as well as a directive to make the information public and available to everybody. VCGI, VTRANS, and AppGeo all worked on this initiative by working directly with towns. VCGI now updates the layer annually. All ROW data are public.
To view the ROW data, VTRANS uses a web mapping application called the Vermont ROW Spatial Data Hub. The agency’s goal is to make all features hosted on the application part of authoritative datasets (Figure 12). ROW lines are entered in through scanned plans or DGNs brought in through a script, which are then put in an enterprise GDB (Figure 13). Data attributes include project information, links to a digital print room which is serviced by Amazon Web Services (AWS), and CAD data. OnBase and ArcGIS Pro are used for georeferencing plans and for most day-to-day operations, but the web-map services to ArcMap. The GIS staff are currently manually reviewing the DGNs to correct for any errors from invalid DGN sources. The boundary surveys were championed by VCGI, which took the initiative to create a land survey library. VTRANS GIS staff are working directly with the survey staff to process survey DGNs through a different script than the one processing ROW lines. The DGNS need to be reviewed manually, with photos attached. VTRANS GIS staff are working on creating a standard naming convention to more easily sort through ROW lines and photos.
The VTRANS land inventory dashboard is another Esri web mapping application that highlights parcels that have been flagged from the inventory (Figure 14). The ROW team communicates directly with towns to get more information on these parcels. Consultants do research on properties that VTRANS might own.
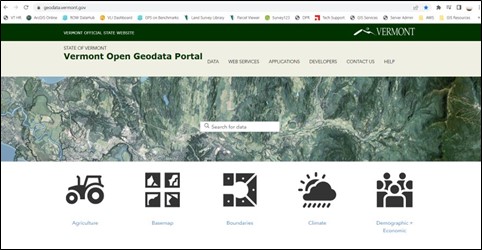
Figure 11. Vermont Open Geodata Portal. This website is managed directly by VCGI.
Source: Vermont Agency of Transportation
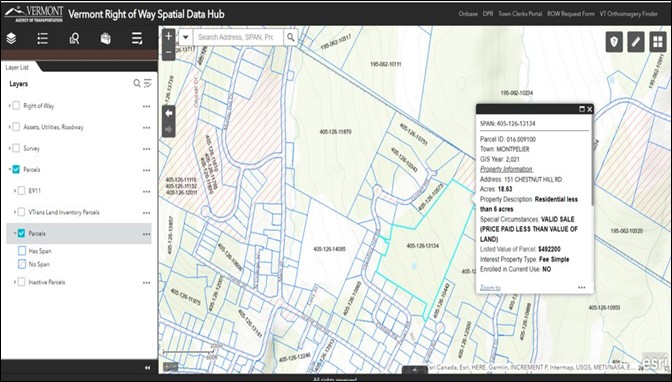
Figure 12. Vermont Right of Way Spatial Data Hub. A user can view parcels, right of lines, and more as layers on this web mapping application.
Source: Vermont Agency of Transportation
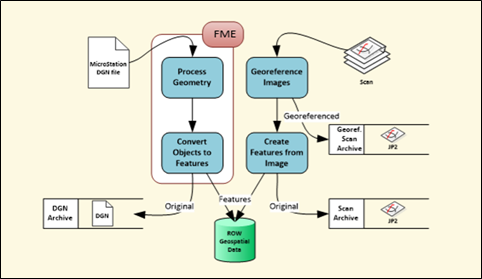
Figure 13. VTRANS Workflow for converting DGN files to GIS ROW data.
Source: Vermont Agency of Transportation
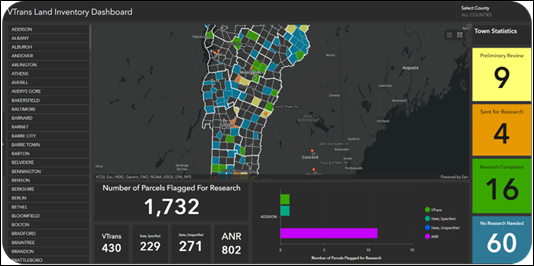
Figure 14. VTRANS Land Inventory Dashboard.
Source: Vermont Agency of Transportation
Return to top
Breakout Sessions - Challenges and Potential Solutions
Challenges voiced during the breakout sessions centered around data management, data confidence, and gathering enough resources (funding, staff, etc.) to continue digitizing ROW parcels. Additionally, agencies noted challenges in making technological advancements such as the use of GIS in real estate processes.
Overall, State DOTs interested in uses of GIS for ROW would benefit from increased opportunities to interact and dialogue with one another on these topics. FHWA can support States in these and related efforts. States would like to have more understanding of peer experiences and are looking for strategies to help them better present information to a non-technical audience. States also see a strong need to more effectively engage users who will benefit directly from implementation of GIS for ROW applications. ROW professionals would also benefit from having aerial maps as educational and communication tools to use in their interactions with landowners. ROW planners also need to be able to better educate agency leadership/management on the value and capabilities of GIS.
Data Management and Quality
- Peer exchange participants noted that they are not always fully confident in their agency’s ROW data and therefore it can be difficult to “market” the data to users. It can also be difficult to balance the needs of various stakeholders. For example, surveyors may want survey-grade maps, but planners do not require survey-grade maps. There may also be confusion regarding what constitutes “survey-grade” data. While ROW data can be used for analysis, it is not survey grade. The most common workflow is to process data from plan sheets, but there may be more current information available to an agency that not all staff are aware of.
- To address these challenges, MnDOT is working to build an application that can present five quality factors/confidence levels of data. While MnDOT wants to prevent misinterpretation in the data, it is also difficult to educate users on how exactly the data should or should not be used. It is very time intensive to search for documents that may help to illustrate the level of accuracy in the data; even the most recent survey data may not be accurate. Typically, data users have expressed satisfaction with data that are accurate to within 10-20 feet, but MnDOT’s goal is always to increase data accuracy.
- Another solution may involve reviewing parcels at a county or town level and compare a State DOT’s data to local government data. CDOT is exploring this approach but is still determining what the “end goal/checkpoint” should be for announcing full data confidence. CDOT ROW/GIS staff are considering meeting with different stakeholders or steering committees to determine which attribute information is most useful and what level of detail must be captured for both internal and external data use. The goal is to determine data standards and establish standard operating procedures.
- Agencies could consider creating metrics for georeferencing plats that define the maximum level of residual error and set this standard both internally and for consultants.
- Agencies may also consider possible involvement from legal teams to help write disclaimer statements regarding data quality.
- Peer exchange participants noted difficulty in determining exactly how much land is owned by the State DOT.
- For example, MnDOT GIS/CAD analysts have found that calculating the number of acres in a polygon produces more accurate results than using a centerline. Using this method the team has completed calculations for about 9,000 out of 100,000 parcels.
- User accessibility is a concern for data portals and web mapping applications. It is difficult to track who is using the data, the databases/applications/portals, and for what purposes.
- For example, WisDOT staff are working to create an updated version of READS that requires specific fields of data to be entered and flags empty fields for review. Staff are also interested in creating an application that can be easily used and updated while field staff are collecting data on the ground.
- In some cases, there can be too much information in State open data portals, making it hard to determine which datasets are authoritative. At the same time, there may be limited information available on ROW parcels. For example, in some cases, real estate agents have purchased the same parcel twice because there was no record of a previous purchase. Many agency ROW/GIS staff are exploring strategies to increase data accuracy and data-entering efficiencies.
Funding Challenges
- States may confront different funding challenges. To address these challenges, States could consider applying for FHWA technology transfer grants, utilizing FHWA pool funds, or seeking funding from different departments within their agencies. A FHWA technology transfer grant could allow one State to work with another that has successfully implemented ROW solutions.
- CDOT highlighted the need for ROW funding and how having more complete ROW data may benefit the community at large. For example, a CDOT staff member spent 8 months talking with various agency leadership teams abut how to apply ROW data to benefit safety and other CDOT goal areas before funding was received.
- Some agency ROW teams want to begin using drones to support ROW data-gathering, particularly to document where there is encroachment on a property. However, some State DOTs do not own drones or have any drones available for ROW purposes.
- Some State DOTs are working to address funding challenges by selling surplus properties to cover expenditures.
- End users of ROW data may not fully understand the extent of work that goes into creating the ROW maps, even updating PDF maps to GIS format. It can be difficult to get agency buy-in to provide more resources to ROW data activities. Having more full-time employees working on applying GIS to ROW could be helpful. In many cases, GIS work is done via an agency’s central GIS staff at headquarters and there is a need to improve coordination and communication between the central office and any field or regional staff.
Staffing and Data Sharing
- To address staffing needs, agencies could consider developing a binder of resources with instructions for this work to train newer staff. Developing standard operating procedures could also be a useful strategy to maintain institutional knowledge and ensure effective knowledge transfer for newer staff or interns.
- VTRANS noted that its main challenge is turning ROW lines into polygons. VTRANS has three full-time GIS staff who are using georeferenced maps from the 1900s and DGNs to complete this process, with an emphasis on trying to automate workflows when possible. Other VTRANS challenges include developing standards for DGN/CAD file naming conventions. GIS staff are currently working with robust scripts to set data management standards. These scripts feed into an enterprise geodatabase that the GIS team can review or use to create feature classes that can be uploaded to a web map. The GIS team plans to continue advocating for the documentation of workflows and metadata to train new staff efficiently.
- To assist with improved coordination and communications, VTRANS reported that it has facilitated steering committees/user group meetings for stakeholders both within the agency and with the VCGI. The UDOT GIS group meets every two weeks and hosts a GIS “knowledge share” meeting monthly. However, because ROW is a niche subject matter, it can be difficult to generate broad interest in the topic.
- CDOT noted that it can be difficult to keep up with the ROW workload. Due to the overwhelming number of parcels remaining in CDOT’s analysis, it has been helpful to contract out ROW work and rely on interns, but training and managing interns can requires time and resources; when interns leave after a short time period, there is also a need for continual trainings. CDOT is exploring the idea of hiring a temporary position employee who can dedicate time to this project.
- State DOTs noted that they would benefit from increased collaboration between ROW GIS staff and end users of the data. Additionally, agencies noted that improved documentation of data workflows and standards would be useful as a strategy to onboard new staff.
Potential Working Group
- Participants expressed interest in creating a working group or user group to support ongoing coordination and information sharing. This group could be created through an MS Teams channel, email list, Slack channel, etc. It is worth considering if there should be two separate user groups, with one specifically reserved for discussing more technical aspects of GIS work. The group, or groups, could meet every few months or so for a presentation or facilitated discussion.
- It would also be beneficial to send out a voluntary survey to willing agencies to determine how many staff are involved in ROW work and GIS ROW work specifically. It would also be useful to learn more about what percentage of agency staff time is allocated to ROW work. The resulting data could help with improved baselining. The data could also help States that have less staff and funding to better advocate for their needs to upper management.
- More States want to incorporate the use of data dashboards and find ways to use ROW products for safety solutions.
- FHWA can support States through offering coordination and information-sharing forums (such as the peer exchange) and increasing awareness of grant opportunities.
Return to top
Appendices
Appendix I. Agenda
| Tuesday, March 7th Time (MT) |
Topic |
| 8:30-9:00 AM |
Introduction and Agenda Review
FHWA (Mark Sarmiento and Peter Clark) welcome attendees, reviews the agenda, and introduces GIST Program. |
| 9:00-9:45 AM |
State Presentation 1: Minnesota |
| 9:45-10:30 AM |
State Presentation 2: Wisconsin |
| 10:30-10:45 AM |
Break |
| 10:45 AM - 12:00 PM |
Breakout Session 1: GIS/Realty
The Focus of this session will be on the present. Current policy and program issues and activities your department is being asked to do. Create a list of challenges, why are they challenges and ways you have addressed them. |
| 12:00-1:30 PM |
Lunch
|
| 1:30-2:15 PM |
Roundtable: Discussion of Breakout Session 1
|
| 2:15-2:45 PM |
State Presentation 3: Virginia |
| 2:45-3:15 PM |
State Presentation 4: Utah
|
| 3:15-3:30 PM |
Break |
| 3:30-4:30 PM |
Summary and Wrap Up |
| 4:30 PM |
Adjourn |
| Wednesday, March 8 Time (MT) |
Topic |
| 8:30-8:45 AM |
Introduction and Agenda Review |
| 8:45-9:15 AM |
State Presentation 5: Vermont |
| 9:15-10:45 AM |
State Presentation 6: Colorado |
| 10:45-11:00 AM |
Break |
| 11:00-11:15 AM |
Colorado GIS Applications |
| 11:15 AM - 12:00 PM |
Breakout Session 2: Two Groups - GIS/Realty
The focus of this session will be on future. Discussion of solutions, effective practices in general and specific challenges that were mentioned on Day One. |
| 12:00-1:30 PM |
Lunch |
| 1:30-2:15 PM |
Roundtable: Discussion of Breakout Session 2 |
| 2:15-2:45 PM |
Presentation: Mark Sarmiento - Examples of States’ Data Portal Activities |
| 2:45-3:00 PM |
Break |
| 3:00-3:45 PM |
Roundtable
Discussion on what are common themes, as well as how to collaborate between states in the future. What are the next steps, needs, and lessons learned. Was there something you were hoping to learn that we haven’t discussed? What resources can FHWA and other national organizations provide to you? |
| 3:45-4:30 PM |
Summary and Wrap-Up |
| 4:30 PM |
Adjourn |
Appendix II. Participants
| Name |
State/Organization |
Position |
| Peter Clark |
FHWA |
Realty Specialist |
| Mark Sarmiento |
FHWA - Office of Planning |
Community Planner |
| Sara Secunda |
Volpe Center |
Geographer |
| Remi Work |
Volpe Center |
Program Analyst |
| Kathi Lion |
Colorado DOT |
Statewide Survey Coordinator - PLSII |
| Nick Mesenbrink |
Colorado DOT |
GIS Section HQ - GIS/CIM Specialist |
| Cameron Petitt |
Colorado DOT |
Real Estate GIS Specialist/Property Management Group |
| Christine Rees |
Colorado DOT |
ROW Program Manager |
| Zack Shenk |
Colorado DOT |
Real Estate Specialist - HQ Support for Regions |
| Jeff Bellen |
FHWA Colorado Division |
Area Engineer and Right of Way Program Manager |
| Reed Adams |
Virginia - VDOT |
State Utilities and Property Manager/ROW and Utilities Division |
| Ben Teran |
Utah DOT |
GIS Administrator/ROW Division |
| Ryan Tiu |
Utah DOT |
Senior GIS Analyst/ROW Division |
| Jose Aguilar |
Minnesota DOT |
ROW Mapping Unit Supervisor |
| Julie Groetsch |
Minnesota DOT |
Assistant Director of Land Management |
| Joseph Mandelko |
Minnesota DOT |
CAD/GIS Analyst |
| Elisabeth Fenn |
Vermont Agency of Transportation (VTRANS) |
GIS Professional, ROW Team |
| Joshua Plaksa |
Vermont Agency of Transportation (VTRANS) |
GIS Professional, ROW Team |
| Joe Casper |
Wisconsin DOT |
Real Estate Lead Worker |
| Norman Pawelczyk |
Wisconsin DOT |
Bureau of Technical Services Chief |
| Sandra Villiesse |
FHWA Wisconsin Division |
Transportation Specialist/ROW Program Manager |
Return to top

