Webinar 47
Developing Ohio DOT’s Transportation Information Management System (TIMS)
June 24, 2021
Summary of the Federal Highway Administration’s Quarterly Webinar
Background
The Federal Highway Administration (FHWA) promotes geographic information systems (GIS) as a means to more effectively manage and improve transportation systems. One of the ways that FHWA does this is through its GIS in Transportation program,[1] which identifies timely and critical GIS issues and topics in transportation and connects transportation agencies with available resources and best practices. The webinar summarized here is part of a quarterly series organized through the GIS in Transportation program.
Stephen Hale (Stephen.Hale@dot.ohio.gov) of the Ohio Department of Transportation (Ohio DOT) presented on the efforts of Ohio DOT to develop and maintain their Transportation Information Management System (TIMS). TIMS allows users to use the GIS team’s established data standards to publish their own data in SQL, instead of manually updating spreadsheet files. TIMS shifts the burden of light data processing to the users, allowing GIS staff to focus on managing data from a high level and analyzing Ohio DOT’s overarching needs. TIMS facilitates transparency in the data management process and empowers staff to utilize data belonging to other staff members. This freedom of information also encourages all staff members to maintain clean, high-quality datasets.
A recording of the webinar is available here.
TIMS Introduction
TIMS is Ohio DOT’s web-mapping portal where users can discover information about Ohio’s transportation system, create maps, and share information. TIMS serves several roles at Ohio DOT―housing linear referencing tools, providing a centralized database, and providing a web mapping application. Ohio DOT’s TIMS serves as a champion for data governance as well as a data download portal.
Ohio DOT chose to pursue TIMS as throughout Ohio DOT data sources were decentralized and obtaining data to make decisions had become challenging due to the need to track down the data. Furthermore, TIMS helps ensure data quality as previously unexposed data created quality issues. Finally, TIMS helped Ohio DOT adopt GIS throughout the agency. Data mapping and visualization were very manual, requiring GIS technicians to produce static maps.
Evolution of TIMS
The creation and implementation of TIMS throughout Ohio DOT has been accomplished using a phased approach where each phase builds on the previous phase and addresses known limitations and challenges. Figure 1 depicts the approximate timeline of the evolution of TIMS, from initial implementation through future plans.
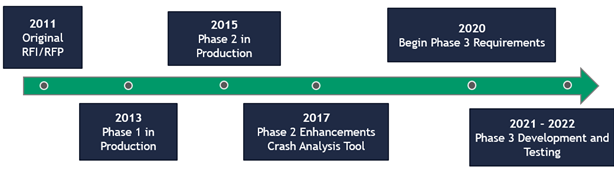
Figure 1. Illustration. Ohio DOT TIMS evolution timeline.
Phase 1
TIMS Phase 1 exposed the power of GIS to Ohio DOT. Several administrators and executives began to understand that GIS is more than a map on the wall. Phase 1 development occurred between 2011 and 2013 with the initial release in the spring of 2013. Phase 1 of TIMS provided Ohio DOT with enterprise GIS data, analysis tools, and linear referencing system tools. It quickly revealed that there were areas for Improvement, including general user experience and administration difficulties. Figure 2 provides a snapshot of the early user interface.
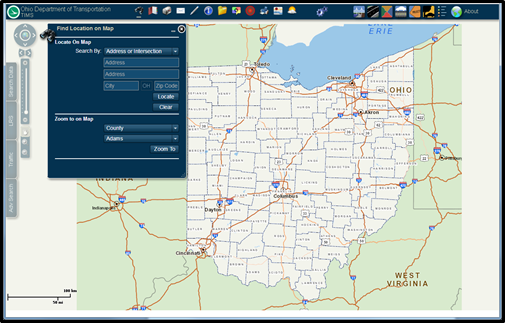
Figure 2. Map. Phase 1 user interface.
Phase 2
Through the development of the statewide property parcel data map, VTrans identified several lessons learned, including:
Phase 2 of TIMS provided a framework where updates to system content such as adding new layers or adding a new PDF map do not require typical IT project management involvement. Further updates included an administrative console to manage content. Phase 2 was released in February 2015 with a goal of developing an expanded site, improving user experience, providing better administration, and delivering a mobile application. Figure 3 shows the improved user interface. Phase 2 implemented an enterprise SDE database, which was a major step toward enterprise GIS. During this phase, Ohio DOT leveraged ArcServer to provide map, feature, and GeoProcessing services. Finally, Phase 2 implemented an LRS server object extension that helped facilitate LRS adoption. Areas for improvement identified during Phase 2 included the tools and map interface as well as a need for a data glossary.
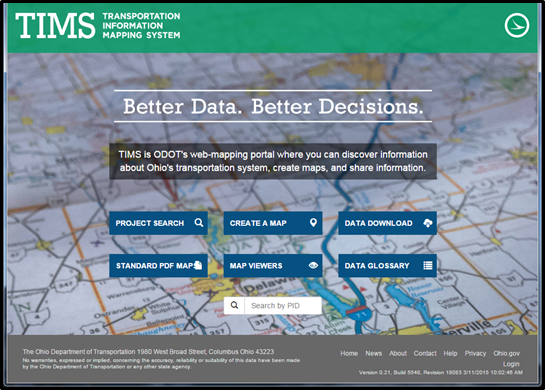
Figure 3. Screenshot. Phase 3 user interface.
Phase 2 Enhancements
In the spring of 2017, Ohio DOT made additional enhancements to TIMS’ Phase 2 existing framework. Enhancements included an improved map and tool interface, addition of a crash analysis module, the ability to produce a custom Ohio DOT Basemap, and an improved data glossary workflow. Figure 4 shows the enhanced map and tool interface. Even with these improvements, Ohio DOT identified the need to improve data discoverability as well as the need for an intuitive tool design.
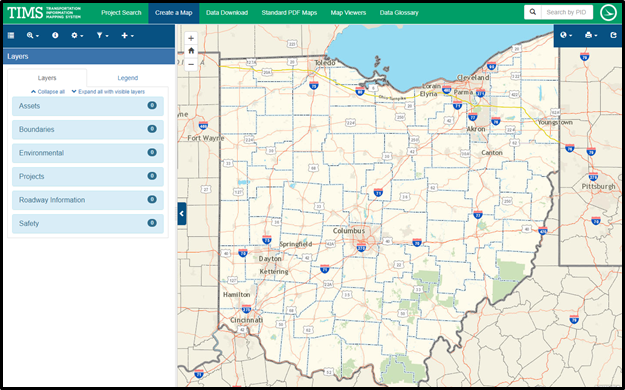
Figure 4. Screenshot. Enhanced map and tool interface.
Maintenance and Data Enhancements
Since the 2017 enhancement through today, Ohio DOT has continued to maintain and make enhancements to TIMS. During this time period Ohio DOT has focused TIMS content through the development of a dataset and map viewer as well as a custom basemap. Additionally, Ohio DOT has continued to modernize their ETL processes. During this time period, Ohio DOT began to conduct more deliberate asset management activities. To support asset management, Ohio DOT has built a transportation asset management decision support tool into TIMS. TIMS has also supported Ohio DOT’s focus on developing, enhancing, and standardizing “asset management” data during this time period. Finally, Ohio DOT has continued ongoing TIMS training and support.
Phase 3: Future of TIMS
In preparation for the next phase of TIMS, Ohio DOT has conducted stakeholder engagement by using Formstack Surveys sent to the broad group including internal and external users as well as compiled user feedback from years of trainings and support. Through this feedback, Ohio DOT identified several areas for improvement to include in the next phase of TIMS. These improvements include:
- Data discovery – How can we streamline how users search for and discover data?
- Data accessibility – What measures can be taken to improve the utility of our existing data (domains, aliases, attribute organizations, etc.)?
- Metadata – How can we standardize the creation and management of metadata while providing a better tool to deliver content to end users?
- Modernize tools – How can we deliver better, more intuitive tool interactions?
- Modernize user interface – What changes can be applied to reduce user fatigue and incorporate modern application design?
- Enhanced administrative capabilities – How can we enhance the administrative functions to create more application flexibility and integrated customer communication?
Challenges and Lessons Learned
Although Ohio DOT has found success with TIMS through the years, they have identified several challenges and lessons learned along the way. The first challenge that Ohio DOT encountered was data management. Ohio DOT emphasized the need for data documentation, identification of data dependencies, and defining data administration versus utility. The second challenge they identified was determining desired usability. Ohio DOT noted the need to balance functionality to cross skillsets. The next challenge was regarding communication. Ohio DOT noted that a need exists to identify and develop email lists, in-app communications, and “news” updates through the agency.
Questions & Answers
Did you create your spatial database from scratch? Or was it assembled from several existing databases?
When Phase 2 started the database was created from scratch. Other databases were migrated to create the base database. We pulled from several databases throughout the agencies. We now have a data warehouse. This helps make the point that processes are needed to collect the data to fill the databases.
How often do you update the spatial features? Is this incorporated in your python scripts?
TIMS data applications are essentially static as there are no data changes during the working data. All the datasets are updated via ETL with several datasets updated nightly. Other datasets are updated weekly with most highway datasets being updated annually.
For dataset downloads, particularly CSVs, is there a way to find out what each column header means?
Yes, users can visit the glossary webpage for TIMS. The glossary webpage can be found here.
Return to top


