Webinar 45
Using GIS for Data Dashboards: Oregon Transportation Safety Data Explorer (OTSDE)
November 18, 2020
Summary of the Federal Highway Administration’s Quarterly Webinar
Background
The Federal Highway Administration (FHWA) promotes geographic information systems (GIS) as a means to more effectively manage and improve transportation systems. One of the ways that FHWA does this is through its GIS in Transportation program,1 which identifies timely and critical GIS issues and topics in transportation and connects transportation agencies with available resources and best practices. The webinar summarized here is part of a quarterly series organized through the GIS in Transportation program.
Kristie Gladhill (kristie.w.gladhill@odot.state.or.us) and Jennifer Lanzarotta (jennifer.lanzarotta@odot.state.or.us) of the Oregon Department of Transportation (ODOT) presented on the Oregon Transportation Safety Data Explorer (OTSDE) and their lessons learned.
A recording of the webinar is available here.
History of OTSDE
When ODOT’s Transportation Safety Division updated the agency’s Transportation System Action Plan in 2016, they identified a number of emphasis areas. On the engineering side, ODOT developed the All Roads Transportation Safety program, known as ARTS, to allocate Highway Safety Improvement Program (HSIP) funds to safety projects. The ARTS program uses proven countermeasures and prioritizes projects based on benefit/cost ratio. ODOT divides the Highway Safety Improvement Program funding between hotspot and systemic problems. Systemic funding is further split among three of Oregon’s high crash problems:
- Roadway departure crashes.
- Intersection crashes.
- Bicycle and pedestrian crashes.
To have a successful transportation safety engineering program, ODOT wanted to choose good projects at the right locations that would be able to reduce fatal and serious injury crashes. To do that, ODOT needed to screen for where problems exist, as well as be aware of projects that are already planned.
The ODOT Region 1 traffic manager wanted to be able to visualize corridors to help identify safety projects for the ARTS program. GIS layers were used to screen for problem locations and already-planned project locations. To cover hotspot and systemic groupings, showing not only crashes but also other network screens for problem locations, and to see where projects were already planned, more than a dozen GIS layers would be needed. ODOT had a number of shared licenses for this so multiple users could access the ArcGIS desktop. However, only two developers were within ODOT. Therefore, ODOT slowly moved staff away from using the ESRI desktop software and filling staff needs with web-based maps and applications.
In addition to the GIS desktop limitations, the ARTS program had the following set of needs:
- It had specific layers that they needed to have access to in order to run their analyses.
- It had to be able to run through a very specific workflow with very specific outputs.
- A lot of time was put into developing an MXD file, a file format in which the maps created from ArcGIS software can be stored, as well as developing the system to update the MXD file.
When ODOT learned that ArcGIS Online (AGOL) would allow anyone inside or outside of the ODOT network to access the map without issue, it was an easy decision to make the transition to AGOL. Due to the existing system being so well defined, detailed information about what needed to be included and how the application needed to look and function were easy to identify. Although OTSDE originally focused on just one of ODOT’s regions, the scope was expanded to cover all of Oregon as the advantages were easy to sell, including:
- Common data source.
- No GIS skills required for users.
- Publicly available.
- Faster than desktop ArcGIS.
- Easy data export.
What Can OTSDE Do?
OTSDE was designed to be capable of covering the safety data needs for ODOT. The tool was designed to be user friendly with no GIS skills required. ODOT wanted OTSDE to be comparable to Google maps. Users can turn layers on/off with a click of the box to the left. Layer groups can be expanded or rolled up by clicking on an arrow. In the left panel in Figure 1, as in other GIS tools, layers are listed in hierarchical order. ODOT identifies layers for crash data, transportation projects, the Active Transportation Network Inventory (ATNI), ARTS screening layers, and resource layers. Widgets give users functionality in the tool, and can be used to access tools or information. Users can see three widgets under the search box; the other widgets appear in the upper left.
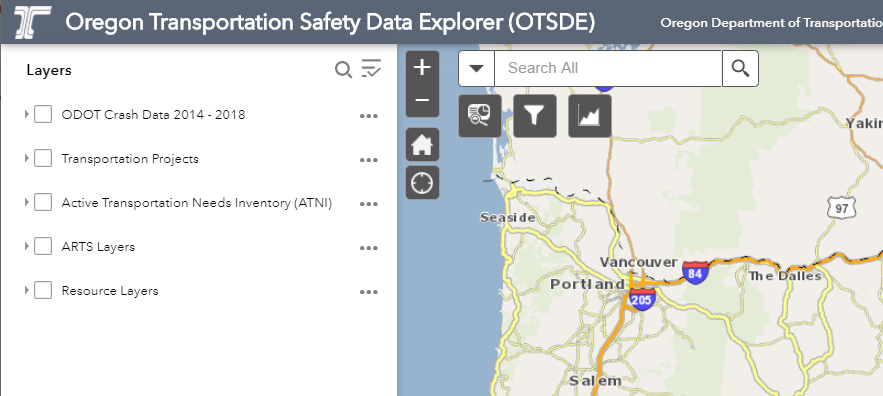
Figure 1. Oregon Transportation Safety Data Explorer layer display.
Presenters provided a brief demonstration of the different ways OTSDE can be used. Applications of OTSDE include:
- Visualize corridors and see underlying data.
- Multimodal data visualization (bike and pedestrian data).
- Crash data visualization.
Institutional Challenges
Three institutional challenges were identified through the development of OTSDE. The first was the loss of a champion. The initial GIS analyst assigned to this project left the agency but was replaced by a dependable and competent employee who was able to continue the effort. Furthermore, the original champion of the tool changed jobs and was granted permission to assist through the beta phase of the tool development.
The second challenge was data stewardship. Through the development of OTSDE, ODOT was changing and firming up data stewardship practices. ATNI layers had come from pilot projects; however, the asset management group within the agency felt they were the ATNI data “owners.” Fortunately, this data ownership issue was resolved and, going forward, a process was set up that is now used by the entire GIS group to check any new layers to clearly define the data owner and prevent similar problems.
The final challenge was ownership of the tool. The tool was developed from a user request; it did not originate from the crash analysis reporting unit. However, early in the tool development, several requests were combined into one: visualize corridors; select crashes on a map and be able to export them; and include multimodal data. Therefore, the tool has users from several different groups within the agency, which was the goal; however, it also meant no single manager felt their group “owned” the tool. Since the development of the tool, its capabilities have expanded beyond a single group within ODOT and a stakeholder group was developed to have oversight of the tool, with representatives from six different groups in the agency.
Questions & Answers
Do you provide “time-enabled” maps/apps, with a time-slider for time of day, month, or other timeframes?
Some of the maps and apps that ODOT releases do provide this; however, OTSDE does not currently have the functionality, but does have a filter a user can use to enter a date or date range to filter the crash data. It does not function quite as smoothly as the official time slider, but there are only so many things one can include in an application without affecting its speed.
Does ODOT have an enterprise Data Governance Program to oversee systems like this? If so, how is it involved in this app?
There is a data governance program, not just for ODOT but for all State agencies working together to make sure they are consistent. As far as OTSDE goes, new layers that come in must follow the data governance program.
Is there any way to filter the crash data for commercial vehicles only? Or might such a filter be considered in the near future?
Currently, there is no way to filter crash data for only commercial vehicles. To do so, a user would need to filter vehicle type and then look at the crash data.
Is there a difference between internal and external access to OTSDE?
No differences exist between internal and external access to OTSDE. However, because of data security, there are some things that ODOT can share only to internal workers.
Is there external access to this tool, e.g., Traffic Records Coordinating Committee, law enforcement, etc.?
OTSDE is publicly available, but ODOT does sometimes receive specific requests from law enforcement needing more detailed data.
Are web services used in the application shared as rest endpoints as well?
Yes. The web services used in the application are also shared as rest endpoints.
Return to top


