Webinar 43
Using GIS to Create a State of the System Map
May 27, 2020
Summary of the Federal Highway Administration’s Quarterly Webinar
Background
The Federal Highway Administration (FHWA) promotes geographic information systems (GIS) as a means to more effectively manage and improve transportation systems. One of the ways that FHWA does this is through its GIS in Transportation program,1 which identifies timely and critical GIS issues and topics in transportation and connects transportation agencies with available resources and best practices. The webinar summarized here is part of a quarterly series organized through the GIS in Transportation program.
Jennifer Wiltgen (Jennifer.Wiltgen@state.mn.us) and John Zehnder (John.Zehnder@state.mn.us) of the Minnesota Department of Transportation (MnDOT) and Norine Wilczek (Norine.Wilczek@state.mn.us) of Minnesota IT Services presented MnDOT’s State of the System Mapping Application and their lessons learned.
A recording of the webinar is available here.
Corridor Investment Management Strategy (CIMS)
In 2012, MnDOT began an effort to use GIS to create a series of PDF and paper maps displaying information, by corridor, about MnDOT’s trunk highways. This information included infrastructure condition, transit infrastructure, and safety recommendations. Local governments appreciated having the information available as it led to more informed discussions about investment needs for the trunk highway system. However, the information quickly became out of date and keeping the maps up-to-date was a large effort.
More recent advancements in GIS technology and online interactive maps have enabled MnDOT to not only update the data in the maps, but create a new format entirely—one that is interactive and online. The Metro District of MnDOT began the effort to update the maps with new data using an interactive story map.
Benefits of ArcGIS Online and Story Map Format
When developing the new maps, MnDOT was interested in a format that allowed for the presentation of a large volume of data in a dynamic way, in one place, to internal and external audiences. ArcGIS Online provided MnDOT with this format.
MnDOT quickly realized that keeping the mapping data-up-to date is a monumental task. However, with ArcGIS Online, MnDOT is better able to switch datasets to a service-based model, allowing them to better deal with keeping the data up-to-date. MnDOT’s goal for the project was to primarily rely on services that were tied to regularly updated databases, leaving less for them to update in the long run and making the project more manageable. In addition to allowing MnDOT to rely on services for their data, the ArcGIS online format allowed them to display their information in a more interactive way. With ArcGIS Online mapping, users can select the data they want to display easily through pop-up windows. Users can click on and off certain layers to display and set certain datasets to be viewable only at certain scales, providing links so users can access more information about that specific layer. The online format allowed MnDOT to be creative with the data and has provided opportunities for displaying data that weren’t previously available in the last iteration of maps.
After creating a new online format, MnDOT still had the issue of presenting a great deal of data in one place. In the last original State of the System Map, MnDOT had multiple maps with “themes” such as existing conditions, recent investments, etc. Each theme provided the complete picture for each corridor. Even with the new interactive format, there was too much information to display on one single map. Through research, MnDOT identified that there were several story map formats available that could be used to accomplish this task. One of the formats, called the “Map Series” (a map with separate tabs across the top) was the format they eventually selected.
Assembling the Data
The State of the System map was an effort to pull multiple different datasets together which were related in subject and together, provided a comprehensive picture of the state of the MnDOT transportation system. However, the datasets were developed and maintained differently and based on different sets of assumptions. Each dataset can also have different update cycles based on different roadway or line networks. MnDOT resolved some of these issues by separating the datasets into different maps within the overall story map. They resolved others by maintaining a specific update cycle.
For example, although the Freeway and Non-Freeway congestion layers have similar subject matter, the way they developed the measures and interpreted them is completely different. The Freeway Congestion layer includes a measure of congestion (speeds under 45mph) very specific to freeways and the Non-Freeway Congestion layer measures average speed as a percentage of the overnight speed as a way of measuring free flow. MnDOT had a significant amount of concern that one measure of congestion would be conflated with the other by multiple stakeholders while MnDOT was gathering feedback on the map. To avoid any potential confusion, MnDOT separated the congestion layers into two maps.
MnDOT also has a combination of static data and services. Due to the nature of the map, MnDOT’s datatsets contained a lot of study information and results. The study information is only updated when a new study comes out or a project is completed, whereas the data brought into the map via services are updated as frequently as every day or as infrequently as twice per year. With so many datasets with different update cycles in one map, it became important to clarify how to define each cycle, including how regularly they are updated through a supplemental document called “the layer definitions” PDF. MnDOT noted that this is essentially their metadata. There is a link to this layer in every map the State DOT produces so that the user has access to detailed information about every layer, the update cycle, and how that information was derived.
The biggest challenge MnDOT encountered in the development of the map was the predicted condition data. In this map, there are a few sets of condition data and they are arguably the most important components of the map. These datasets include pavement condition, bridge condition, and culvert condition data. The culvert condition data come from a service and are contained in a database, which is updated fairly frequently. However, the bridge and pavement condition datasets are static.
The pavement and bridge condition data include existing condition ratings, but they also have a predicted condition. The predicted condition derives from a model that factors in several variables to determine future condition. One of these variables includes the programmed and planned projects for a bridge or pavement segment in the next 10 years. Although these variables create a defined output, projects change, move in and out of different years, and are sometimes dropped from the program altogether. This makes the future condition for these infrastructure sets extremely variable. Since the future condition of the pavement and bridge layers and the planned projects map are based on the same dataset—but at the same time can vary—there is a need for an annually updated static dataset. A static dataset helps MnDOT make sure that the datasets are all pointing to the same snapshot in time, and ensure that the datasets (future conditions and planned projects) are consistent with one another. MnDOT determined an ideal update timeframe for all datasets. In the end, the bridge model, pavement model, and the Planned Projects map will all pull data from the same set of projects when the Statewide Transportation Improvement Program (STIP)/Capital Highway Investment Plan (CHIP) is finalized in the fall.
State of the System Map Demonstration
At the conclusion of their presentation, MnDOT provided a demonstration of the State of the System Map as well as their Geospatial Commons. Below is a sample screen from their State of the System Map as well as their Geospatial Commons.
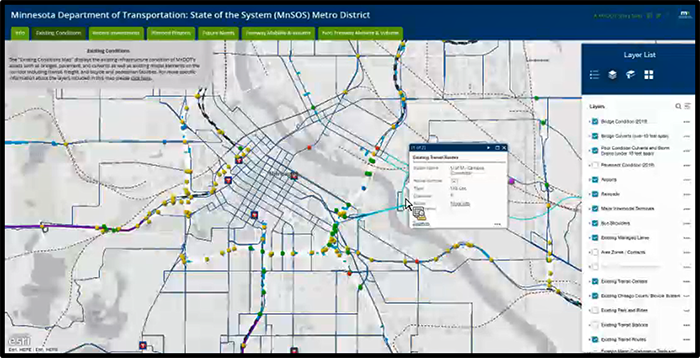
Figure 1. MnDOT State of the System Metro District – Existing Condition Map
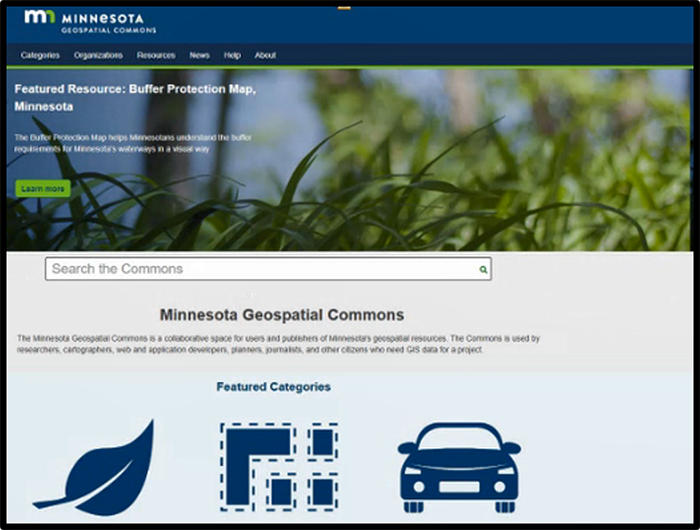
Figure 2. MnDOT Geospatial Commons Homepage
Questions & Answers
Is the Geospatial Commons just for government entities or is it open to universities or non-governmental organizations to be able to load data into and use it? Do you know how that is set up?
The Geospatial Commons is open to the public but has a lot of data from government organizations, universities, and counties, including the University of Minnesota, the Minnesota Valley Transit Authority, the Metropolitan Emergency Services Board, and the North Fork Watershed District.
Is the Geospatial Commons hosted at a university or some state agency?
The agency that hosted the Geospatial Commons is MnGO—the statewide geospatial information office. They host this service. If someone is interested, they will contact them on how to get their data there. They are kind of the umbrella; they cover all the different agencies within the state. They are a great resource for sharing data.
How did you transition from the PDFs to a story map? Did you have separate web-based or GIS maps?
In the original effort, they used GIS to create the map and then it was sort of broken up by corridor and the different themes for each corridor. When MnDOT went through this effort to update originally it was just thinking about updating the old PDFs. Then MnDOT realized that it could be put into an online, interactive format.
Would you say that the primary audience for the map is more the general public?
The original audience for this was primarily cities and counties. It is really meant to be a planning tool that can help initiate discussions.
With regard to the layers, some seem only available at certain zoom levels. Is there a way to know—like for the bridges—that the data is there without a user having to zoom in?
Yes. The data is noted in the layer list.
How is road imagery collected and how is it used?
In terms of the base map, the data is collected based on the street centerline.
Return to top


