Data Dashboards Peer Exchange
Summary Report
Virtual Peer Exchange
October 20, 2020

Participating Peer Agencies
Arizona Department of Transportation
Michigan Department of Transportation
North Carolina Department of Transportation
Oklahoma Department of Transportation
West Virginia Department of Transportation
Prepared for:
Office of Planning
Federal Highway Administration
U.S. Department of Transportation
Table of Contents
Purpose
The Federal Highway Administration’s (FHWA) Geographic Information System (GIS) in Transportation program sponsored a virtual peer exchange on October 20, 2020 to bring together practitioners of GIS applications to discuss and learn about how State Departments of Transportation (DOTs) are using data and data dashboards to support agency operations and decision making.
Peer agencies included the Michigan DOT, Oklahoma DOT, and West Virginia DOT. Representatives from Arizona DOT and North Carolina DOT attended the peer exchange but did not present.
FHWA hosted this virtual peer exchange via Microsoft Teams in a one-day session that included a series of presentations from three peer agencies followed by two roundtable discussions. The exchange concluded with a discussion of next steps that FHWA can take to inform and assist State DOTs in creating and advancing data dashboards as internal and external resources. To help manage and highlight the overall effort, FHWA asked the United States DOT (USDOT) John A. Volpe National Transportation Systems Center (Volpe Center) to develop a report that provides a summary of the peer exchange, background and summaries of each presentation, themes, roundtable discussions, and next steps for participants.
↑ Return to Table of Contents
↑ Return to Top
Background
FHWA initially recognized the need for a peer exchange based on interest from State DOTs and metropolitan planning organizations (MPOs) through the GIS for Transportation (GIS-T) 2019 Survey administered by the American Association of State Highway and Transportation Officials (AASHTO). Through the same AASHTO survey, the GIS in Transportation Program team identified several State agencies that have experience using data dashboards to improve transportation operations. The team conducted further research into the list of transportation agencies identified and selected agencies that had significant experience with dashboards.
Participants expressed the need to share information among peers on the current state of practices and projects undertaken to create and use data dashboards for operations and other agency needs. With that goal in mind, the Volpe Center and FHWA reached out to appropriate stakeholders in the field and invited them to participate in this peer exchange.
↑ Return to Table of Contents
↑ Return to Top
Peer Presentations
Michigan DOT: Using Culvert Lifecycle Management in Emergency Management
Michigan DOT (MDOT) started using Esri’s ArcGIS to revamp and revitalize its culvert collection efforts in 2016 to increase efficiency in their asset management practices. Since then, MDOT has mapped more than 46,000 culverts using ArcGIS Collector and Survey123. MDOT mapped the location of the culverts along with basic information in ArcGIS. When identifying the culverts, the survey teams used Survey123 to record maintenance data, which enabled MDOT to respond swiftly to any maintenance concerns like cleaning, repair, or replacement.
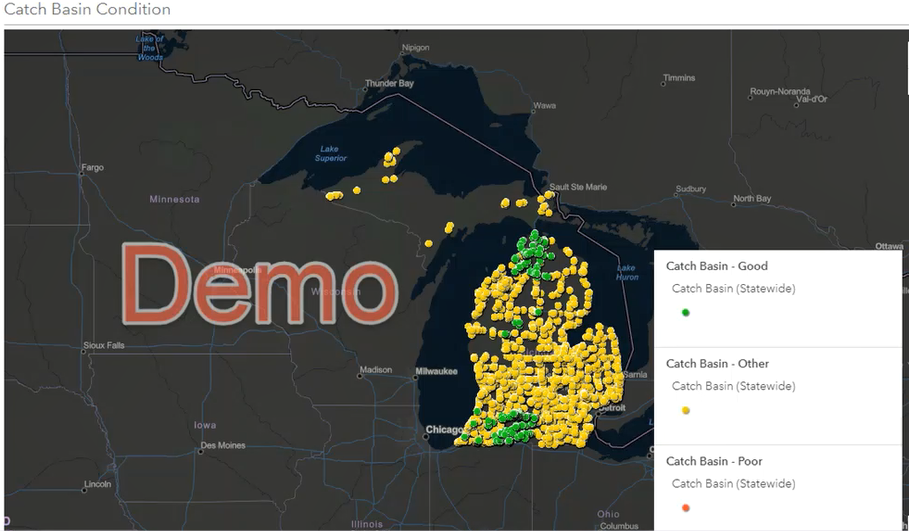
Figure 1. Illustration. MDOT culvert collection dashboard. The image above displays asset condition information for a catch basin. Image courtesy of MDOT.
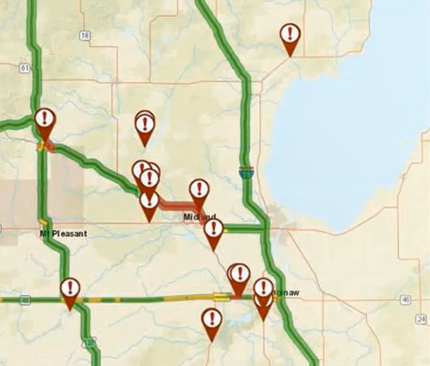
Figure 2. Map. MDOT dashboard map of road closures during May 2020 flooding event. Image courtesy of MDOT.
MDOT uses these data in two different dashboards: one tracks the condition status of the asset, and another tracks the inspection status of the asset. The condition status dashboard enables each office to better manage their assets by tracking condition information in a single location. The inspection status dashboard displays how often the assets are inspected with the goal of working together with regional staff to determine which cycle works best for each asset. MDOT uses these dashboards to guide agency response to regular and emergency maintenance needs; for example, MDOT used these dashboards to guide recovery efforts after severe flooding in May 2020, particularly to track road closures. The dashboards helped MDOT staff identify road closures across the State and prioritize recovery efforts. MDOT also used this dashboard to coordinate with agency partners, including Michigan State police, Michigan Department of Energy, Great Lakes and Environment, and the FHWA Emergency Relief Program.
MDOT continues to advance their asset management efforts using GIS. Next steps for MDOT include improvements in GIS involvement for the entire asset lifecycle from design, construction, and maintenance into planning and forecasting, to better enhance information sharing and decision making throughout the organization.
Oklahoma DOT: Using Data Dashboards to Streamline Information Access
The Oklahoma DOT (ODOT) GIS team has rapidly gained experience in using data dashboards to track project progress, maintain asset inventories, and evaluate team performance metrics. ODOT identified ArcGIS Online (AGOL) as a vital tool for internal and external information sharing that helps inform decision making across the agency.
ODOT’s four heavily utilized dashboards include:
- County Certification Dashboard
ODOT created this dashboard in response to heavy user requests for updated certified mileage data at the county level; this dashboard provides up-to-date, accurate information for county commissioners seeking to use this data in required reporting documents, and to inform decision making. ODOT and its partners use the dashboard to filter and summarize data via an easy-to-use platform.
- MAP-21 Dashboard
This dashboard summarizes and visualizes targets for safety, bridges, pavement, and system performance for travel time. ODOT created this dashboard to replace a cumbersome PDF map with an interactive tool that displayed visual information over static charts.
- Asset Inventory Dashboard
ODOT created this dashboard to replace an outdated web map and to improve communication between departments for data; this map eliminated the need for personal requests to the GIS team for individual queries. The dashboard allows users to filter data to find asset information and download relevant information on assets like signs, rumble strips, signals and lights, auxiliary lanes, pavement markings, and guardrails.
- AVC Daily Dashboard (COVID-19)
The governor’s office requested this dashboard to monitor adherence to stay-at-home orders by analyzing daily traffic volumes. The team created this dashboard using data from a spreadsheet provided by the governor’s office; the information is now accessible both internally and externally using a single link and is updated daily.
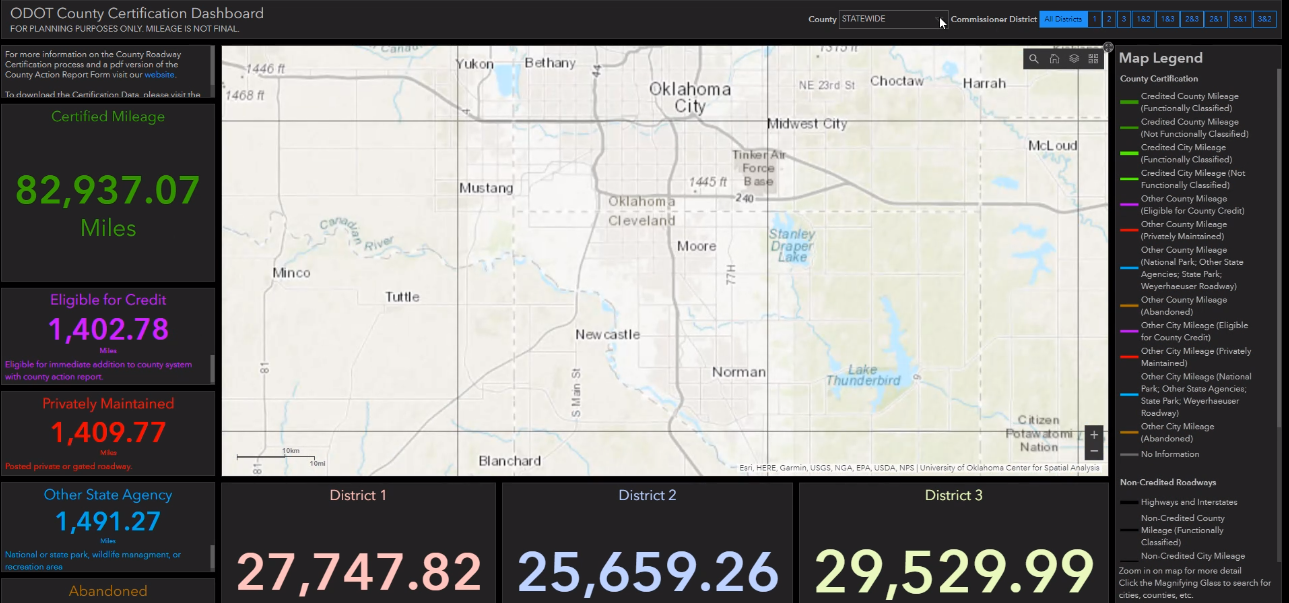
Figure 3. Illustration.
ODOT dashboard displaying county-level certified mileage data. Image courtesy of ODOT.
Given the success of these and other dashboard projects, ODOT plans to expand the use of dashboards for projects across the agency. In particular, ODOT sees data dashboards as important tools to help the agency track progress on strategic goals, and to track overall project progress outside of mandatory reporting deadlines.
West Virginia DOT: Data Dashboards as Tools for Communication, Transparency, and Project Tracking
Since their implementation, data dashboards have become a vital communication tool for West Virginia DOT (WVDOT) and their partner agencies. These dashboards are especially helpful given the sheer number of assets under WVDOT jurisdictions: WVDOT is the owner and operator of over 94 percent of roads within the State; data dashboards are important tools that WVDOT uses to track and share information internally and externally.
WVDOT uses multiple Esri products—ArcGIS Enterprise, AGOL, and the ArcGIS Desktop application—to create dashboards. One, the 2020 West Virginia Projects Dashboard Web Application, provides the public with live status updates on current highway projects and activities. WVDOT uses the dashboard, hosted on AGOL, to display information about paving, core maintenance, roads to prosperity, bridges, and slide repair projects. To adhere to business principles, WVDOT combined all major projects and activities together on a single map. This tool has revolutionized how WVDOT communicates with the public about DOT projects and has dramatically increased transparency both inside and outside of the agency.
WVDOT also operates an internal dashboard, like their MS4 dashboard. WVDOT created the MS4 (multiple separate sewer system) dashboard to automate and simplify the process that environmental coordinators, supervisors, managers, and others use to evaluate projects. Hosted on the ArcGIS portal with Esri’s dashboard theme, the MS4 dashboard allows users to save drain locations and inspection dates, which helps the GIS team maintain information quality control in real time. This dashboard improves WVDOT’s ability to track project status accurately and across departments, thereby improving coordination and increasing project delivery efficiency.
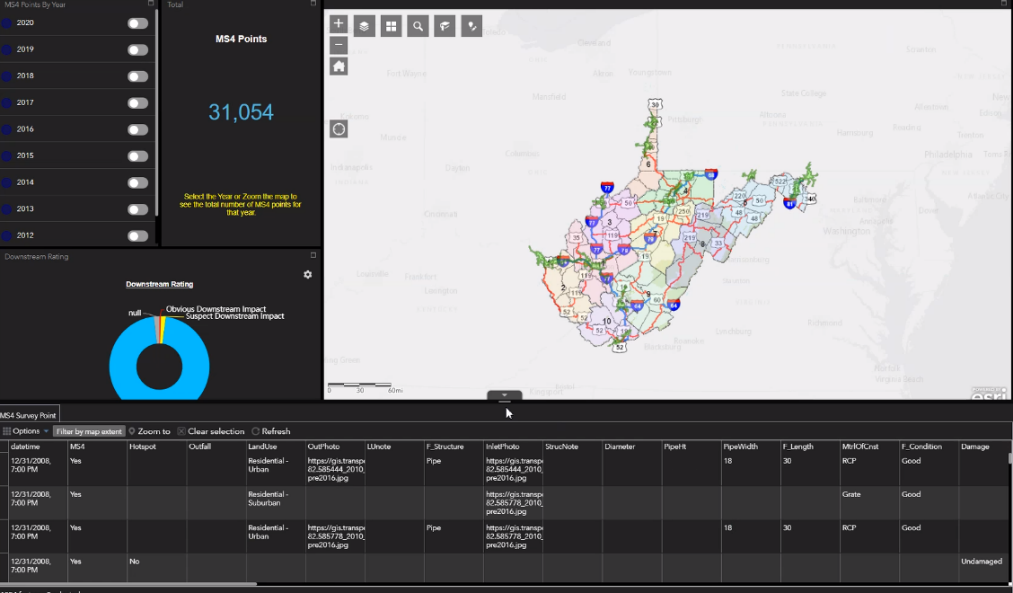
Figure 4. Illustration.
WVDOT dashboard for integrated GIS solution for MS4 data collection. Image courtesy of WVDOT.
Moving forward, WVDOT seeks to improve data governance and data warehousing, helping facilitate program- and portfolio-level dashboard management. The State DOT expects these changes will help the agency streamline procedures and increase overall coordination. WVDOT also wants to make dashboards an integral component of GIS project outputs, provide training and facilitate knowledge transfer across the agency, and partner with other agencies to increase the use of data dashboards in project and performance management.
↑ Return to Table of Contents
↑ Return to Top
Roundtable Discussions
Following the three presentations, peers engaged in two roundtable discussions on the tools they use for dashboards, the challenges they encountered, and overall best practices. The following sections provide key takeaways from these discussions.
Peers regularly balance challenges related to dashboard design and data. Design standards may vary from agency to agency, and even department to department. Peers have had to develop and apply a strategic approach for displaying their data. This has not only saved time and energy in prototyping for some peers, but also ensured State DOTs communicate information in a way their intended audience understands. Most peers agreed that simple visuals can help make communication between developers and stakeholders clear and concrete.
Peers also noted that understanding the data they use and its limitations is very important. In one case, a peer noted they had limited leeway in the data they could display as their request originated from the Governor’s office. In another case, a peer had to recreate maps from a PDF to a dashboard. The data presented needed to remain the same, as did the specific color scheme.
According to the peers, it comes down to who the audience is and what are their needs. In some cases, their priority is getting a dashboard published as fast as possible. In other cases, there is more time to develop and perfect the dashboard.
Within and outside their State DOT, each peer has had to coordinate with multiple groups before publishing their dashboards. Peers have worked with internal and external audiences to understand what data to display and how they should display them. Coordinating with the communications department, for example, has been instrumental for one peer when developing their dashboards. According to the peer, public specifications exist for the web maps they publish. Some of their dashboards include disclaimers. Such disclaimers are needed because the data they are sharing is not controlled by the agency. As a result of not controlling the data, the State DOT cannot alter the data, which is something they try to make clear to dashboard users. Another peer noted their dashboards require a disclaimer as requested by their public relations group.
Staffing and training can be significant constraints for State DOT GIS groups. Some peers noted they are understaffed in their GIS group, which is exacerbated by an increased demand on having mobile and online versions of maps and data. State DOTs have to rely on training available to staff to meet GIS demands, including developing dashboards. While some agencies have used online training programs such as Esri’s Enterprise Advantage Program (EEAP), other agency staff indicated they are self-taught.
Among peers, similar products are commonly used. Among the agencies surveyed, all agencies used one or more Esri products to develop their dashboards. Most agencies had specific enterprise agreements with Esri to provide software and training services. Using out-of-the-box software offers less flexibility than developing custom software. On the other hand, some out-of-the-box options such as AGOL provided peers with relatively quick and responsive development.
State DOTs can benefit from additional Federal support to help develop and deploy dashboards with geospatial components. All peers expressed a need for increased Federal resources to help them communicate information to their partners, ranging from data management strategies and the importance of good data practices to basic GIS vocabulary for nontechnical users.
↑ Return to Table of Contents
↑ Return to Top
Conclusion and Lessons Learned
Data dashboards with geospatial components continue to increase in popularity among State DOTs and the transportation industry as a whole. To continue developing successful dashboards, it is important to understand some of the best practices and related challenges other State DOTs have faced. The following is a list of lessons learned as identified during the peer exchange:
It is important for developers to understand the goal of the project and the data needed prior to a project’s development phase. Dashboards are only as successful as those who use them. It is therefore essential that developers understand the end goal of a dashboard during development, to guide the development process. It is also beneficial for the developer to understand how and what kind of data will be collected.
When prototyping a dashboard, test the look and feel of a dashboard across different monitors with varying resolution. While a dashboard can look and function as expected on the computer monitor it was developed on, output can look very different on other monitors. One peer noted a loss of details when using smaller and lesser resolution monitors compared to higher quality monitors.
Visually and technologically accessible products may increase dashboard use. Ease of use heavily influences the success of dashboards; users will not continue to use products that are confusing or cumbersome. It is important for developers to test their products with different audiences to collect usability data.
It is important to educate internal and external audiences about GIS and data dashboard capabilities to manage expectations and encourage more widespread use. Agencies that clearly communicate the intent and capabilities of GIS dashboards to potential audiences may help increase use of the tool. An increase in use may then lead to less redundant information requests, improving overall customer satisfaction. It is also important for State DOTs to understand how to share data with GIS teams. Some peers noted that the more detailed and clear the data shared with them are, the easier it is to build a dashboard for them. Communicating the format and level detail needed in the data is essential for the success of a dashboard.
Standardization and transparency will help agencies increase data dashboard efficiency. Implementing transparent standards—from data quality to communication procedures—will help agencies save time and resources. Standard elements for data collection and visualization help ensure agencies do not reinvent policies and procedures for each dashboard. Standards for data dashboards can also help improve overall data governance across the agency, which in turn may help GIS teams better manage incoming data quality and improve project output.
Agility and flexibility are key at every point in the dashboard process, from creation to implementation. To prevent common challenges—like tight timelines or poor data quality—from delaying or destroying a project, developers must be open and responsive to changing project elements. When agility and flexibility are built into a project from the beginning, it may be easier for developers to introduce changes and revisions to the original design, instead of starting from scratch. Implementing standards may help agencies adjust to these changes, as well as shifts in personnel and resources.
↑ Return to Table of Contents
↑ Return to Top
Next Steps
Following the day’s discussions, some agencies noted additional tools and capabilities they plan to explore for expanding their existing dashboard portfolios:
- Invest in Staff Development in a Variety of Software
One agency commented that, upon the expiration of their Microsoft licensing agreement, their leadership decided to switch to Google Suite. The team now needs to invest in educating their team on the new procedures and capabilities as they transition to new software such as IBM’s Power BI. The team mentioned that it would be advantageous for FHWA stakeholders if technology developers like Esri worked more closely with vendors like Google to ensure their products can move between host systems more easily.
- Explore Multiple Software Options
One agency mentioned using the Esri Experience Builder to make their maps more dynamic and user friendly.
- Introduce Mobile Device Compatibility
Agencies expressed a need for technology that is more compatible with mobile devices so their users can have access to maps and dashboards outside of a computer.
↑ Return to Table of Contents
↑ Return to Top
Appendix A: Peer Exchange Agenda
Tuesday, October 20, 2020
| Time (ET) |
Topic |
| 1:00 - 1:15 P.M. |
Welcome and Introductions
FHWA (Mark Sarmiento) welcomes attendees, reviews the agenda, and introduces GIS Program.
U.S. DOT Volpe Center provides an overview of logistics, describes documentation/follow-up, clarifies roles and responsibilities, and establishes ground rules for discussions.
Participants introduce themselves via the chat pod with their name, agency, and what they want to achieve during the peer exchange.
|
| 1:15 - 2:15 P.M. |
Peer Presentations
- Michigan DOT
- Oklahoma DOT
- West Virginia DOT
|
| 2:15 -2:25 P.M. |
Break |
| 2:25 -3:10 P.M. |
Roundtable Discussion
Current Tools Used by State DOTs and Lessons Learned |
| 3:10 -3:55 P.M. |
Roundtable Discussion
Future Plans – Next Steps for Dashboards and the Support Needed to Continue Them |
| 3:55 - 4:00 P.M. |
Wrap up and Adjourn |
↑ Return to Table of Contents
↑ Return to Top
Appendix B: Peer Exchange Participants
↑ Return to Table of Contents
↑ Return to Top


