Asset and Performance Management at State DOTs
Case Studies of Select Transportation Agencies
June 2021

Prepared for:
Office of Planning
Federal Highway Administration
U.S. Department of Transportation
Notice
This document is disseminated under the sponsorship of the Department of Transportation in the interest of information exchange. The United States Government assumes no liability for the contents or use thereof.
The United States Government does not endorse products or manufacturers. Trade or manufacturers’ names appear herein solely because they are considered essential to the objective of this report.
| REPORT DOCUMENTATION PAGE |
Form Approved
XXX
|
| Public reporting burden for this collection of information is estimated to average one hour per response, including the time for reviewing instructions, searching existing data sources, gathering and maintaining the data needed, and completing and reviewing the collection of information. Send comments regarding this burden estimate or any other aspect of this collection of information, including suggestions for reducing this burden, to Washington Headquarters Services, Directorate for Information Operations and Reports, 1215 Richmond Highway, Suite 1204, Arlington, VA 22202-4302, and to the Office of Management and Budget, Paperwork Reduction Project (0704-0188), Washington, DC 20503. |
| 1. AGENCY USE ONLY (Leave blank) |
2. REPORT DATE
June 2021 |
3. REPORT TYPE AND DATES COVERED
Final Report |
4. TITLE AND SUBTITLE
Asset and Performance Management at State DOTs:
Case Studies of Select Transportation Agencies |
5a. FUNDING NUMBERS
HW2LA500/UF025
|
6. AUTHOR(S)
Patricia Cahill ORCID 0000-0003-4713-5757
Eric Englin ORCID 0000-0003-4424-7438
|
5b. CONTRACT NUMBER |
7. PERFORMING ORGANIZATION NAME(S) AND ADDRESS(ES)
U.S. Department of Transportation
John A. Volpe National Transportation Systems Center
55 Broadway
Cambridge, MA 02142-1093
|
8. PERFORMING
ORGANIZATION REPORT NUMBER
|
9. SPONSORING/MONITORING AGENCY NAME(S) AND ADDRESS(ES)
U.S. Department of Transportation
Federal Highway Administration
1200 New Jersey Avenue, SE
Washington, DC 20590 |
10. SPONSORING/MONITORING AGENCY REPORT NUMBER
|
| 11. SUPPLEMENTARY NOTES |
12a. DISTRIBUTION/AVAILABILITY STATEMENT
This document is available to the public on the FHWA website at https://www.gis.fhwa.dot.gov/.
|
12b. DISTRIBUTION CODE |
13. ABSTRACT (Maximum 200 words)
In supporting State Departments of Transportation (DOTs) and metropolitan planning organizations (MPOs) in using Geographic Information Systems (GIS), the Federal Highway Administration (FHWA) is publishing this Case Study Report focusing on the use of data collection technologies by transportation agencies to collect and manage geospatial asset and performance data. To gather information for this report, the U.S. DOT Volpe National Transportation Systems Center interviewed three State DOTs and developed a case study focusing on their experiences. The purpose of this document is for State DOTs and MPOs to consider the approach that these agencies have used in employing data collection for asset and performance management to reduce a duplication of efforts and learn notable practices from peer agencies. |
14. SUBJECT TERMS
Geographic Information Systems (GIS), field data collection, asset management, performance management, data management, data collection |
15. NUMBER OF PAGES
24 |
| 16. PRICE CODE |
17. SECURITY CLASSIFICATION OF REPORT
Unclassified |
18. SECURITY CLASSIFICATION OF THIS PAGE
Unclassified |
19. SECURITY CLASSIFICATION OF ABSTRACT
Unclassified |
20. LIMITATION OF ABSTRACT
Unlimited |
Acknowledgments
The Federal Highway Administration and the U.S. Department of Transportation Volpe National Transportation Systems Center would like to thank the participating agencies and interviewees that made this case study report possible. The participating agencies are listed below and the particular individuals who took the time to be interviewed for this report are listed in Appendix A: Case Study Participants.
- South Dakota Department of Transportation (SDDOT)
- Ohio Department of Transportation (ODOT)
- Idaho Transportation Department (ITD)
Table of Contents
| Abbreviations |
Term |
| AASHTO |
American Association of State Highway and Transportation Officials |
| DOT |
Department of Transportation |
| ELT |
Extract, Transform and Load |
| FHWA |
Federal Highway Administration |
| GIS |
Geographic Information Systems |
| GIS-T |
GIS for Transportation |
| GSA |
General Services Administration |
| HPMS |
Highway Performance Monitoring System |
| ITD |
Idaho Transportation Department |
| LRS |
Linear Referencing System |
| MAP-21 |
Moving Ahead for Progress in the 21st Century Act |
| MPO |
Metropolitan Transportation Organization |
| NHS |
National Highway System |
| ODOT |
Ohio Department of Transportation |
| SDDOT |
South Dakota Department of Transportation |
| STIP |
State Transportation Improvement Program |
| TAM |
Transportation Asset Management |
| TAMP |
Transportation Asset Management Plan |
| TIMS |
Transportation Information Management System |
| TPM |
Transportation Performance Management |
| USDOT |
United States Department of Transportation |
1. Introduction
1.1 Background
A geographic information system (GIS) is an effective and increasingly essential tool at State Departments of Transportation (DOTs). With applications in all aspects of their work, GIS has helped State DOTs make better transportation decisions that are more informed and delivered in a cost-efficient, timely manner. While State DOTs have been using GIS in varying capacities over the last 30 years, new technological advancements and program initiatives have presented these agencies with new challenges. The Federal Highway Administration (FHWA) promotes the better use of GIS among State DOTs to help them address these challenges through the GIS in Transportation Program.
From the 2019 AASHTO GIS for Transportation (GIS-T) State Survey, State DOTs identified transportation asset management (TAM) and related activities, like linear referencing systems and data governance, as areas where they are interested in learning how GIS is applied.
This case study report identifies notable practices from State DOTs across the country, specifically describing:
- How State DOTs use data collection and GIS to support asset and performance management practices;
- The available technologies and tools and how States choose tools and methods to support decision-making; and
- The challenges States face and methods for addressing them.
1.2 Methodology
FHWA used the GIS for Transportation (GIS-T) 2019 Survey, administered by the American Association of State Highway and Transportation Officials (AASHTO), to identify State agencies with experience in utilizing asset-related GIS tools to understand and improve the condition of these assets. In this survey, States submitted information about their GIS-related projects and initiatives. The team conducted further research into the list of transportation agencies identified and selected agencies with significant experience in implementing, deploying, and creating organizational “buy-in” to using asset-related GIS tools for their asset management programs. This case study features interviews with the following agencies:
- South Dakota Department of Transportation (SDDOT)
- Ohio Department of Transportation (ODOT)
- Idaho Transportation Department (ITD)
Representatives from each of the identified transportation agencies generously provided their time for a phone interview with the research team. Agency representatives were the most knowledgeable staff on how asset and performance management are developed and used within their organizations. The research team developed an interview guide, found in Appendix B, to use in each of the interviews. This allowed the research team to consistently guide each interview among agencies and produce information that can be compared among respondents.
1.3 Definition of Asset Management
Asset management is the application of performance management toward maintaining and improving transportation assets. The Moving Ahead for Progress in the 21st Century Act (MAP-21) defines asset management as “a strategic and systematic process of operating, maintaining, and improving physical assets, with a focus on engineering and economic analysis based on quality information, to identify a structured sequence of maintenance, preservation, repair, rehabilitation, and replacement actions that will achieve and sustain a desired state of good repair over the lifecycle of the assets at minimum practicable cost” (v23 U.S.C. 101(a)(2), MAP-21 § 1103). 1
In the early 2000s, FHWA supported asset management practices by providing information on data glossaries and building databases relevant to asset management.2 In 2012, MAP-21 directed agencies to provide a risk-based asset management plan for the National Highway System (NHS) to improve or preserve the condition of the assets and performance of the system. Mandated assets are limited to pavement and bridges, but State DOTs are encouraged to include all infrastructure assets within the highway right-of-way in their risk-based asset management plan.3
Many State DOTs are going beyond the initial direction from MAP-21 because they found significant value in understanding and maintaining the condition of their assets. FHWA supports State DOTs in advancing asset management practices, including the development of risk-based asset management plans. These plans provide a framework for developing the investment strategies to address infrastructure condition targets, as well as addressing risk and managing assets for their whole life at the least practicable cost.
TAM focuses on transportation infrastructure and its use in directly impacting the following three goals:
- Keeping the infrastructure in as good or better condition than it is now;
- Developing and implementing a logical capital improvement plan; and
- Containing the costs of planning, building, operating, and maintaining the facilities.
1.4 Definition of Performance Management
Transportation performance is “a strategic approach that uses system information to make investment and policy decisions to achieve national performance goals.”4 Today, national Federal-aid Highway Program performance goals as established by Congress relate to the following priority areas: safety, infrastructure condition, congestion reduction, system reliability, freight movement and economic vitality, environmental sustainability, and reduced project delivery delays. Each performance area has language on strategic goals and objectives. The performance goal for infrastructure condition is “to maintain the highway infrastructure asset system in a state of good repair.” [23USC §150(b)].
States followed procedures and guidance FHWA’s Office of Transportation Performance Management (TPM) supports agencies using data to understand the current status and outcomes of the transportation system. These performance measures will be specific to each strategic priority area but the process generally remains similar regardless of underlying data and priority area. Figure 1 describes the high-level process for TPM. This involves informing investment decisions, monitoring performance, and focusing on creating more connected and productive communities.
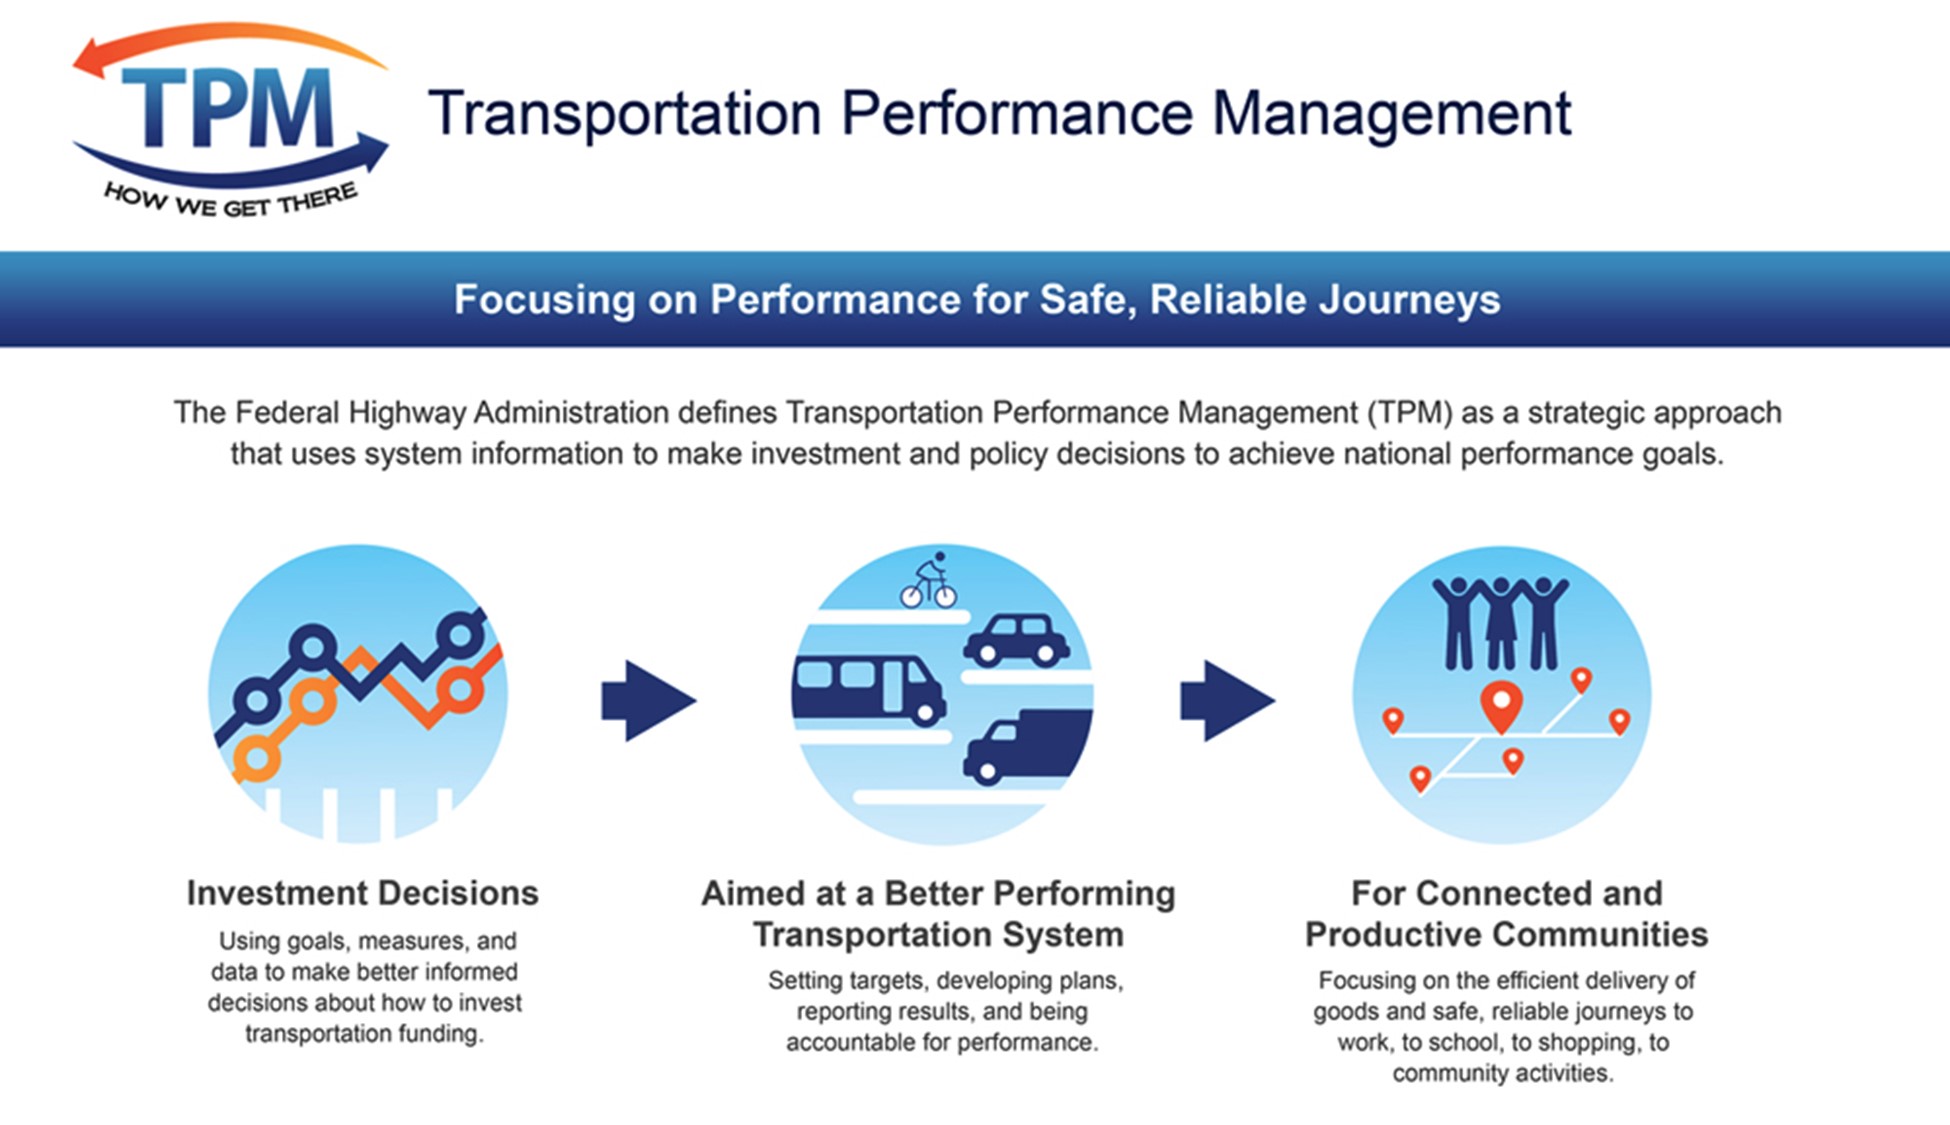
Figure 1. Illustration. Transportation Performance Management (TPM) overview. Source: FHWA.
In short, TPM:
- Is a systematically applied, regular, and ongoing process;
- Provides key information to help decision makers understand the consequences of investment decisions across transportation assets or modes;
- Improves communications among decision makers, stakeholders, and the traveling public; and
- Ensures targets and measures are developed in cooperative partnerships and based on data and objective information.
1.5 Notable Practices for Design and Implementation
FHWA’s Transportation Performance Management (TPM) group assembled best practices on how to apply TPM principles to asset management. The starting point is building an organizational understanding of performance management, which is a strategic approach to make investment and policy decisions to achieve national and regional performance goals. With relevant and accurate data, agencies can apply TPM principles to essentially all investment and planning decisions. Performance-based planning and programming can also support investment trade-off decisions.
State asset management plans are already required under new Federal regulation (23 USC 119)5 so these planning documents provide an opportunity to incorporate performance management processes within a State DOT. These plans can be used to develop and communicate asset performance goals around infrastructure condition, cost, and any other relevant criteria. These documents can also outline how future investment strategies will be affected by performance criteria.
Asset management plans, along with bridge and pavement management systems, provide useful information that should be used to create quality future target goals, particularly for pavement and bridges. These plans should aim to create targets for asset condition in accordance with 23 USC 150(d), as well as achieving and sustaining a desired state of good repair. The Transportation Asset Management Plan (TAMP) Annual Consistency Determinations6 provides information on how FHWA reviews asset management plans, including how State DOT investment strategies should aim to achieve these asset management plan goals. It is recommended that State DOTs revisit these goals often to reflect improvements in data quality, analysis tools, and life-cycle planning methodologies.
Lastly, FHWA Division offices are available to support State DOTs working to advance TPM principles and asset management best practices. These can be direct technical assistance, or more generalized information through trainings, webinars, reports, and guidance.
Back to top
2. Agency and Project Profiles
Interviews with Idaho DOT, South Dakota DOT, and Ohio DOT explored the ways State DOTs use GIS tools for asset and performance management. Each of these agencies use GIS tools to engage with and communicate information to internal and external stakeholders. Some agencies use GIS tools for field data collection while others use GIS tools primarily to post-process existing datasets. The unique stakeholders and goals of each interviewee shaped their approach to GIS asset management data collection.
The following profiles identify key components of each agency’s approach to asset management data collection related to performance management, including basic information on their projects, agency structures, and the challenges they faced in making data public.
2.1 Idaho Transportation Department
The Idaho Transportation Department (ITD) is responsible for the distribution of funds for roads, bridges, rail lines, airports, and ports throughout the State. Their Local Road Inventory (LRI) and dashboard help ITD manage their roads. The ITD GIS seven-person team, including the GIS manager, sits in the central office. ITD also employs six analysts in the district offices; however, district GIS analysts are district employees only. These analysts do not work for, though at times they work with, the central GIS team. The ITD decentralized structures enable district analysts to focus on specific regions and areas while the central team handles systemwide projects to establish a statewide schema that enables all teams to share data.
The ITD GIS team, through their collaborations with other DOT departments, has demonstrated the value of GIS for monitoring and tracking asset and performance data. While their work is still growing, their effort to establish relationships with their sister teams—from bridge inspectors to pavement managers—has helped them integrate, if not GIS itself, at least the partnership with the GIS team into standard procedure. This has led to a level of comfort between the GIS team and its partners, which then enables additional use and complexity of GIS across teams. For example, the pavement team—upon working collaboratively with the Highway Performance Monitoring System (HPMS) coordinator and the GIS team—has now become a “super user,” a term the ITD GIS team uses to describe non-GIS team users who have trained with GIS and use GIS on their own projects.
The GIS team and the GIS super users in other departments and district offices at ITD have established a variety of tools to monitor asset and performance data, including:
- The System of Engagement project. The System of Engagement project includes building applications and a suite of tools to inform future projects, technology and tool acquisition, and ideas for training and collaboration. Part of this project is an information-gathering effort for the GIS team, where the central staff collects requests from all of ITD’s business units. This results in a direct return on investment for future work.
- IPLAN. IPLAN is ITD’s web-based portal linking directly to ITD’s authoritative data sources, which enables ITD staff, business partners, and others to access and publish geospatial transportation information. The GIS team owns and operates IPLAN and is in the process of updating it to a new LRS system. IPLAN is also the basis for new projects at ITD, specifically for more internal and targeted maps for business units seeking to improve their asset and performance tracking. The team uses the “Extract, Transform and Load” (ETL) process for each business unit and to standardize data harvesting for IPLAN. Currently, in part due to the improved ETLs, IPLAN uses an active updating process with regular data updates and refreshes. Different business units are starting to see new benefits from using IPLAN as the portal has improved, which can be seen by the following:
- Multiple business units use IPLAN for data collection. For example, at the time of its launch, IPLAN reduced data collection time for HPMS data by 33 percent.
- Idaho Department of Fish and Game, the Idaho State department responsible for preserving and managing Idaho’s wildlife, shares its own data with ITD using IPLAN, enabling improved collaboration on environmental projects.
- ITD departments are increasingly storing their data in file geodatabases, rather than in a spreadsheet or an Access database.
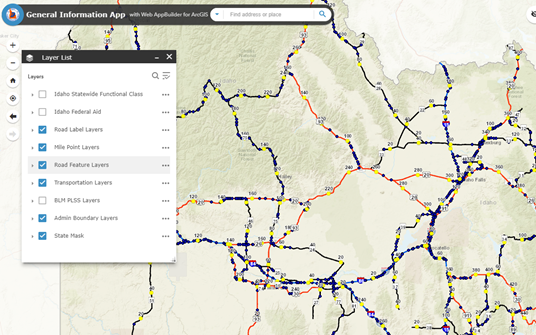
Figure 2. Illustration. ITD’s IPLAN visualizes and maps transportation data across the street. This screenshot from April 2021 displays bridge information across State-owned roads. Source: ITD.
2.2 Ohio DOT
The Ohio Department of Transportation (ODOT) team has been working with GIS to advance asset and performance management for a variety of projects. This begins with its own structure and governance: the GIS team at ODOT sits in the Planning Office, which is itself within the Office of Technical Services. The team collaborates with the Office of Data Governance within the Planning Office. Transportation asset management (TAM) administration is shared between the Technical Services and the Data Governance Offices. The Data Governance Office conducts significant TAM requirements gathering and business relationship management functions, while the Technical Services Office serves as the primary TAMP facilitator and develops GIS technologies based on requirements provided by the Data Governance Office.
Internally, the GIS team helps other departments establish their own asset and performance tracking systems via the Collector application. This web app allows ODOT users to track the performance of 11 assets at the agency as well as project performance, using the same standardized process and data standards across the agency, which has helped ODOT maintain data quality. This data feeds into one of the agency’s largest projects, the Information Management System (TIMS).
TIMS is a web-mapping portal that allows users to access ODOT’s geospatial information, ranging from project-specific performance information to state-of-good-repair asset tracking. In TIMS, users publish their own data in SQL and within the GIS team’s established data standards instead of manually updating spreadsheet files. First released in 2012, TIMS has drastically reduced the amount of time the GIS technical staff spends on the large volume of assistance and data processing requests from ODOT. TIMS shifts this burden of light data processing to the users themselves, and allows GIS staff to focus on managing data from a high level and analyze ODOT’s overarching needs. TIMS facilitates transparency in the data management process and empowers staff to utilize data belonging to other staff members. This freedom of information also encourages all staff members to maintain clean, high-quality data sets. While ODOT teams do not use TIMS for official reporting, TIMS has become the go-to tool for day-to-day reporting and is currently used by up to 3,000 users a month.
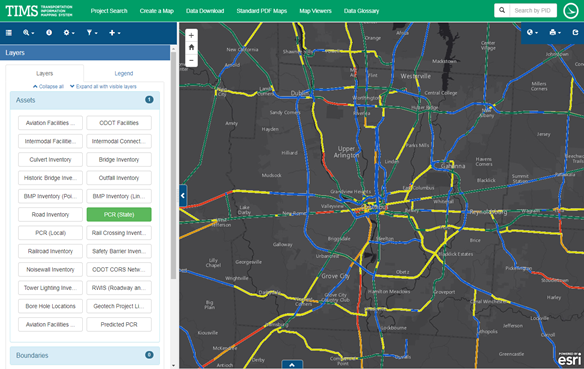
Figure 3. Illustration. ODOT’s Transportation Information Management System (TIMS). TIMS contains more than 80 data sets across 5 Federal and State agencies, 3 ODOT Divisions, and 11 ODOT Offices. Source: FHWA.
ODOT identified their standardized process—used across and outside the agency—as a key piece of success for asset and performance management. This process increased efficiency and reduced both potential mistakes with data entry and the demand on the GIS team’s time, which they can now use for other projects. This standardization also made TIMS accessible and manageable for users outside the GIS team and helped acclimate new users to the portal. Standardization is a key piece in tracking not only the performance of assets and projects across the agency but also the progress of internal business practices, like TIMS.
2.3 South Dakota DOT
South Dakota Department of Transportation (SDDOT) began tracking asset and performance management prior to the Federal mandate with the initial goal of inventorying and understanding the quality of the thousands of culverts along the more than 7,830 miles of roadway the agency owns and operates. Another goal of this inventory was to reduce the impacts culvert needs were having on paving projects due to right of way and permitting processes. Ideally, culvert work is completed prior to paving with enough time to allow a majority of settlement to occur in order to minimize the impact to the new surfacing. The GIS team—from the Transportation Inventory Management Office in coordination with Asset Management in the Administration Office—launched the first version of their Culvert Inspection Program in 2012 as custom software. Since then, the agency has transitioned to using the Collector app with improvements from the GIS team. The team completed the software’s most recent update in 2020.
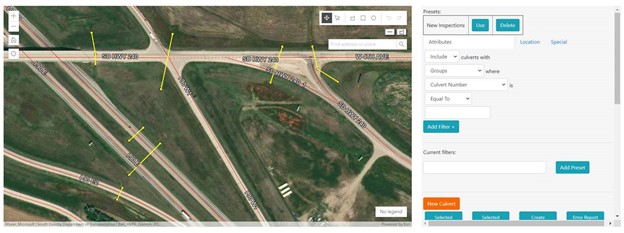
Figure 4. Illustration. SDDOT’s culvert inventory system contains attribute and condition data on over 30,000 culverts along the State highway system. This screenshot from May 2020 shows culvert locations in relation to the highway system. Source: FHWA.
SDDOT reached out to focus groups, AASHTO’s guidance, and other agencies (the City of Sioux Falls and Minnesota Department of Transportation) to inform their process for initially setting up the Culvert Inspection Program. Since then, SDDOT has overcome the initial hurdle of user buy-in, and addressed the complexities of combining out-of-the-box software with custom software. SDDOT uses the original version of ArcGIS Collector to collect data, Microsoft SQL to house data, and a custom web application, ArcGIS online, and ArcMap to access and visualize data.
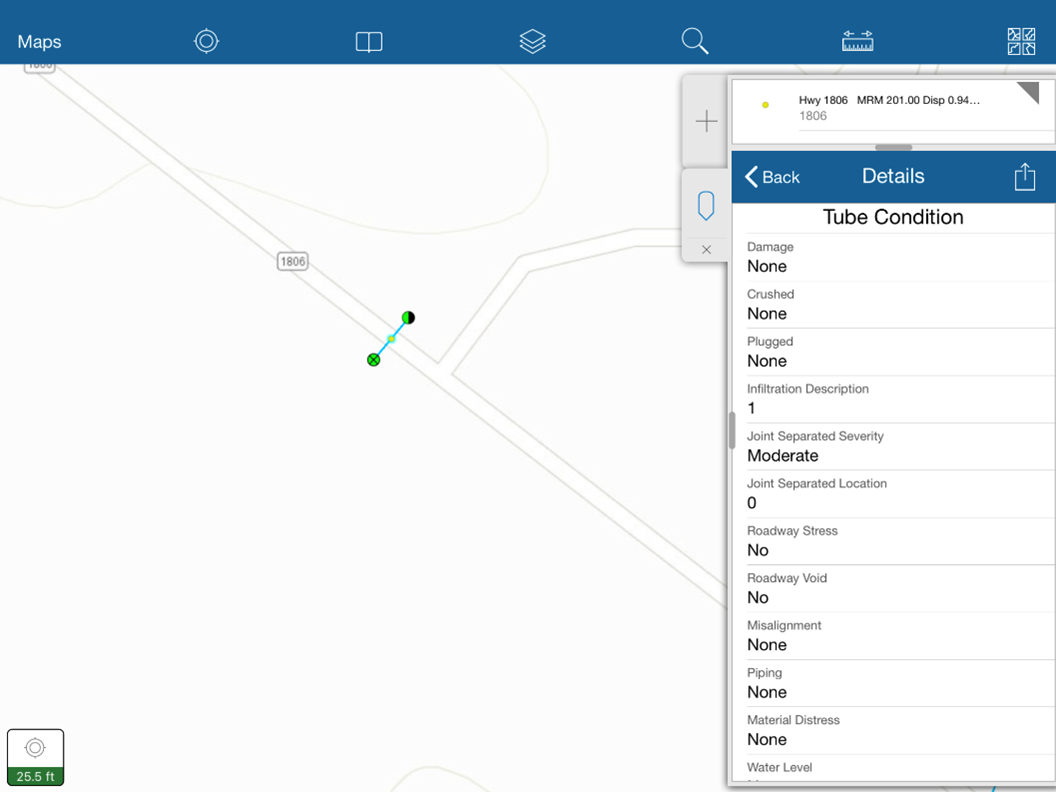
Figure 5. Illustration. Tube condition screen in the original Collector for ArcGIS application. Source SDDOT.
Most reactions to the Culvert Inspection Program and the Collector app have been positive. In particular, some users have shared that it saves them trips to view locations, based on the accuracy and frequency of updated information. However, workload remains the most challenging hurdle. SSDOT shared that it has been a struggle for users to complete all the needed culvert inspections to keep the data current. Some areas that are able to complete their culvert inspections have been able to improve the asset condition using the new process, but there can be challenges with changing their process and starting to use Collector to begin with. For example, SDDOT had not anticipated the initial backlog of 30,000 culverts. However, the dividends have been sizeable. The first inventory spawned $14 million in culvert improvement projects over six years, which has had a significant impact on culvert project planning and investment. The State DOT now sets aside funds in the State Transportation Improvement Program (STIP) for culvert inspections, cleanup, replacements, and rehabilitation/maintenance work.
Looking ahead, SDDOT may use this same process for other asset types and classes like retaining walls, snow fences, and guardrails. SDDOT can use ArcGIS Collector and Survey 123 to collect inspection data for these new asset classes, therefore any new database and program development is possible in-house.
SDDOT maintains that their regular updates and investments in their GIS tools help speed the efficiency—and therefore the agency buy-in—of their programs. Their small team can propel new programs forward by concentrating on breaking down siloes between teams, departments, and even agencies. As their performance record continues to improve, the SDDOT anticipates more of the agency working with them to integrate GIS tools into other asset and performance management protocols.
Back to top
3. Lessons Learned
Agencies may collect and use asset-related data to fulfill multiple objectives. Agencies’ experience with asset management depends on the purpose of their project, its intended audience, and the availability of agency expertise of required technology. This section of the report features advice and lessons learned from agencies that have started or worked extensively on asset management and collection of asset-related GIS data, as well as the implications of these findings for other agencies.
3.1 Asset Data Collection Process
The agencies interviewed for this case study emphasized a few shared key points on their effort to collect and institutionalize asset data collection within their organizations. These lessons learned should support agencies in similar positions to have more success beginning or improving their asset and performance management processes.
3.1.1 Collect consistent asset data
All of the interviewed agencies noted the challenges of their historical data collection processes. In the past, siloed regional divisions or local-jurisdiction partners within each State would monitor assets and collect individualized data that fit their needs. Although this may have been a solution that worked given historical limitations with technology and statewide communication, there are now opportunities to create shared statewide practices on asset data collection. The interviewed agencies each used tools, such as the Esri Collector app and Survey 123, to standardize the asset data collection fields and provide methods for file and picture sharing. This allowed a consistent approach to evaluating assets, which allowed the State DOTs to better understand the current, historical, and planned future condition of their assets.
3.1.2 Look for champions on-the-ground and at management levels
All interviewees reported challenges getting initial and sustained buy-in for the asset data collection processes. For all of the interviewees, their proposed asset data collection process would require many stakeholders within the agency collecting data using new GIS tools and new standards, and it would require a significant starting effort to inventory and assess all the assets. In Ohio, a natural disaster near a major roadway caused the public and management-level stakeholders to initially question the condition of assets. This created an opportunity to start better asset management practices. ODOT interviewees quickly developed and showcased a GIS tool that mapped asset condition and high-risk assets in need of repair, which addressed these concerns. This early success also created an initial set of champions for broader asset management at ODOT.
Although management-level champions can push for agencywide change, on-the-ground stakeholders are critical to creating change that is sustainable and consistent across all the regions of a State. Interviewees reported that each dealt with certain regions that had no champions and were slow to adopt the new process, which resulted in lower quality data from those regions.
3.1.3 Communicate the value of the tool
All interviewees found success when they persistently communicated the value of the tool and how it can make work more efficient and effective. ODOT described starting many meetings or technical trainings with “cross-armed” audiences that did not want to engage with their group or change their process. However, the interviewees from ODOT would spend the meeting clearly communicating their vision for their tool and explain what the value of the data would be to those teams. SDDOT also reported wider communication and trainings as a useful way to understand and address many different types of pushback from area offices and teams.
3.1.4 Leverage success to add more asset types
Two of the interviewees, ODOT and SDDOT, started their effort with specific asset classes of interest. For example, SDDOT initially began with culverts and signs, but they plan to extend their monitoring to include retaining walls, snow fences, and guardrails through similar processes. Once there is some initial buy-in and champions in the organization, asset and performance management processes can be applied to a wide set of assets that the DOT maintains and operates. Only a subset of these are federally mandated, but the management processes can lead to improved understanding of the condition of the assets. This can allow the DOT to better monitor these conditions and mitigate any associated risks.
3.2 Outcomes
The section below highlights the success agencies have achieved after implementing asset data collection, particularly through improved processes for reporting and storing data and increased internal and external stakeholder engagement.
3.2.1 Organizational buy-in and change management
All three case study examples illustrated the importance of including potential users, business owners, and leadership in the development process of new tools and procedures. All project teams faced skepticism toward new technology. Involving potential users in initial conversations, however, can curb skepticism further along in the implementation process. Reaching out early allows for effective communication regarding the tool’s benefit to individuals and the organization as a whole.
In particular, SDDOT heavily engaged with internal stakeholders through a kaizen event to revise their tools and processes, and were not only able to optimize the process for feedback and improvement, but also found that they secured more buy-in after each iteration. ODOT invested in organizational change management training to prepare and support the agency in adapting to new processes.
3.2.2 Complementary roles across departments
Agencies seeking to make procedure and process change, particularly surrounding data collection and utilization, may experience challenges across departments and between agencies in both creating and then using any new tools. Siloes within a department, agency, or across agencies can inhibit information-sharing and ultimately make collaboration difficult. The case study agencies found that creating complementary roles across departments could help mitigate this issue. For example, ITD assists in training staff in other departments to use GIS and the tools the GIS creates, not only to ensure that these departments can utilize GIS, but also to encourage working together to address departmental initiatives. Other agencies call their GIS unit the providers and facilitators of projects, but emphasize the importance of teaching other departments how to use GIS tools and work together with their GIS experts.
3.2.3 Increased engagement with asset management data
As departments and agencies as a whole see the benefits of using asset and performance management GIS tools, they may become more engaged in the data collection and data business process. ODOT reported that after launching Collector and other GIS tools, their peers proactively approached the team to improve their data collection processes and develop their “manual,” which includes procedures and guidance for how to manage and improve how they use GIS tools and data. This also led to an increased desire to collect more detailed asset condition data that can provide more analysis on how asset conditions are changing over time. Overall, case study agencies saw increased enthusiasm and buy-in for their tools as their peers observed how asset management data could inform their projects and improve agency outcomes.
Back to top
4. Conclusion and Next Steps
Agencies seeking to implement or improve data-driven decision-making processes rely on the availability and accuracy of data. Agencies seeking to improve performance and asset management can use GIS tools to improve their data collection processes, which increase the likelihood of gathering useful data the agencies can then use to inform decision-making. Increasingly, agencies are finding that their old data collection processes—often involving recording data in the field with pen and paper—no longer meet their needs. Many agencies are now turning to new technologies and techniques to make their asset data more accurate, centralized, and timely. Regardless of the technology used, asset and performance management data collection efforts can benefit from using notable practices of data governance and effective change management strategies, like early stakeholder engagement, communicating value, and leveraging success to support their efforts.
As described in section 3.2.1 on organizational buy-in and change management, these practices can help agencies create sustainable change within their organization. Performance management focuses on creating more change in how investment and policy decisions, and GIS can provide powerful tools for communication, analysis, and visualization of asset performance. Strategies for improving asset and performance data collection, and using that data to inform agency practices, are evolving as more agencies and partners adopt these practices and as agencies’ needs change. Increasing use of data-driven asset and performance management has great potential to promote and align with USDOT and State DOT strategic goals. Agencies can prepare for the demand for new data by proactively updating their data collection efforts for all of their assets by using some of the technologies and notable practices from the three highlighted projects in this case study.
Back to top
Appendix A: Case Study Participants
| Agency |
Department Type |
Name |
Title |
| ITD |
GIS |
Nicole Hanson |
LRS administrator |
| ODOT |
GIS |
Ian Kidner |
GIS Program Manager |
| ODOT |
GIS |
Stephen Hale |
System Admin |
| ODOT |
Planning |
John Puente |
Chief Data Officer |
| SDDOT |
GIS |
Kimberly Zerr |
GIS Coordinator and Manager |
| SDDOT |
GIS |
Josh Bench-Bresher |
Asset Management Engineer |
Appendix B: Interview Guide
Introduction
Thank you for taking the time today to discuss your agency’s work on asset and performance management. Working closely with FHWA, the Volpe Center is interviewing a handful of State DOTs to discuss the different challenges, best practices, and potential lessons learned regarding how different agencies are using GIS to monitor and improve asset management or program performance. Our objective is to create a collection of case studies that will highlight a range of approaches and practices that can then serve as a guide to other State DOTs, MPOs, and FHWA.
Background
We are going to start this interview with some general background information about your office and your asset or performance management projects.
- What is your role within your agency?
- Approximately how many employees work for your organization?
- What department or team was this project housed in?
- a. How many people were involved?
- b. What is the technical capacity of your team?
- Prior to, or in addition to, federally mandated reporting on assets and performance (PM2), what was your agency’s experience with asset and performance management?
Purpose
Next, we’d like to discuss your project in more detail: first, the impetus for undertaking it, and second, who was involved in the process.
- What problem(s) was this project intended to solve?
- Before implementing GIS and GIS-based tools, how did your agency track asset and performance management?
- Have you changed or improved these tools since the first implementation?
- Please describe that process.
People
- Who were the main stakeholders in this project? Did it require work across departments, and did it have a champion?
- Did you engage with anyone outside your DOT? If so, who?
- If they ask, a project champion is “an individual who has the authority to use resources within or outside an organization for completion of a given project. A project champion is chosen by the management to ensure supervision of a specific project right from its initiation phase to its execution phase.”7
Process
Next, we’d like to discuss the process you used for designing the asset or performance management tool.
- Can you describe the process for designing the GIS tool, including the functionality and aesthetics?
- How did you decide what data to include and the time intervals at which the data is updated?
- Did you have a specific end user group in mind while designing the tool?
- Was the development of your tool(s) completed in-house or contracted out?
- What technical and organizational obstacles did you face in the development of the asset data collection tool(s)?
- What platforms and technologies did you use to create the tool?
- How does your GIS tool interface with your agency’s other systems?
Reactions
The interviewees’ projects may be in different stages of development and deployment. For those projects that are not yet fully developed or deployed to the end user, use the alternate phrasing provided where applicable.
- What have been the reactions of internal and external stakeholders to your GIS data/tool(s)?
- If there were intended end user groups, do these groups use the GIS data/tool like you imagined they would?
- How has the newly available asset and/or performance management data changed your business practices? Has the organization changed any decisions based on this data?
- Has the organization changed any investment decisions based on this data?
- Are there limitations to using the GIS data or tool? Are there plans to improve on the tool in the future?
- Does your agency plan to undertake any similar projects going forward?
- What were your lessons learned for this project?
U.S. Department of Transportation
John A. Volpe National Transportation Systems Center
55 Broadway
Cambridge, MA 02142-1093
617-494-2000
www.volpe.dot.gov
Footnotes
Back to Top


