A Newsletter from the Federal Highway Administration (FHWA)
www.gis.fhwa.dot.gov
WINTER 2013
A Look at the Oregon Department of Transportation's (ODOT) Work Zone Traffic Analysis (WZTA) Tool
Upcoming Events
- AASHTO GIS for Transportation Symposium: “Revealing a Gem”
May 5 - 8, 2013
- Esri International User Conference
July 8 - 12, 2013
- COM.Geo 2013: International Conference on Computing for Geospatial Research & Application
July 22 - 24, 2013
- National States Geographic Information Council's Annual Conference
October 27 - 31, 2013
This edition's Q & A is with Eric Leaming and Brett Juul of ODOT, and Robert Kirkman of HDR, Inc. They discuss how upgrading the organization's Excel-based WZTA tool to a GIS-focused, web-based tool has delivered long-term organizational benefits.
What was the purpose of your agency's original WZTA tool?
For many years, ODOT's Work Zone Traffic Analysis (WZTA) tool was an Excel spreadsheet that allowed engineers to calculate how many lanes of traffic needed to be kept open to safely accommodate road users through work zones while allowing efficient roadwork operations. Using the spreadsheet, engineers could calculate delay estimates and determine optimal times for highway lane closures. The system was used for projects in construction, utility work, surveying, routine maintenance operations, and was a standard tool in project delivery. However, the tool had a number of limitations. It was becoming less effective for handling progressively larger workloads. More importantly, the tool did not display all of the information that traffic engineers needed. Analysts needed to manually collect tabular data such as traffic volume, highway grade, and road classification data to enter into the WZTA tool. They then had to calculate lane closure times based on these manually collected data.
What motivated your agency to upgrade the original WZTA tool?
In 2003, the Oregon Legislature passed the Oregon Transportation Investment Act (OTIA). One portion of the act – OTIA III – provided $1.3 billion to repair or replace 365 state-owned bridges in Oregon over 10 years. One of the primary goals of OTIA is to minimize the impact of these bridge repair activities on statewide mobility to keep Oregon's economy open for business during construction. Soon after OTIA was passed, coordination of projects and corridor mobility management became a primary concern.
One result of OTIA III was a dramatic increase in the demand for work zone traffic analysis. To meet this demand, a consistent and up-to-date source of work zone traffic analysis data, coupled with a quick method of producing analysis results, was needed. The analysis tool also needed to accommodate quick analysis adjustments to reflect frequent project schedule changes. In some cases, multiple concurrent bridge project work along continuous stretches of highway necessitated corridor delay planning. The Excel-based WZTA tool was not robust enough to handle these demands. In 2007, traffic engineers in both ODOT and the Program Management joint venture (JV) Oregon Bridge Delivery Partners (OBDP) decided an upgrade to the tool was necessary.
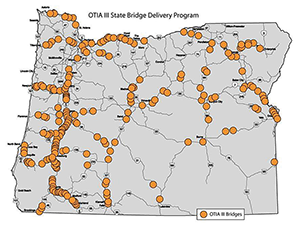 Each orange point represents a bridge that received repair or replacement funding under the 2003 OTIA.
With guidance and oversight from ODOT, HDR Inc. (as part of OBDP), brought together experts in traffic engineering, information systems, and GIS to critically analyze the work zone traffic analysis needs of traffic engineers. The team then designed a custom web-based and GIS-enabled version of the tool. This new version allows traffic engineers to quickly and consistently analyze different traffic scenarios for each project, saving time during project development and construction and allowing these engineers to focus on project quality.
What was unique about the approach the development team used to redesign this tool, and how did this benefit ODOT?
ODOT did not follow a traditional route when redesigning the WZTA tool. A traditional, technology-driven information technology (IT) conversion would have rebuilt the application as a more robust tabular toolkit, simply moving the calculations from a spreadsheet to a relational database. Instead, the ODOT-consultant team focused on ensuring the redesign was driven by benefits and potential return on investment (ROI). This approach led to the development team's decision to redesign the WZTA process itself to provide real and lasting benefits for the agency. Based on this method, the team was expanded to include not just traditional IT professionals, but also ODOT traffic engineers and GIS specialists.
This project served to meet broader ODOT goals, bringing together staff from different parts of the organization to improve efficiencies. Through the collaboration of a multi-disciplinary team and the ROI-based approach, the new WZTA tool has delivered a number of long-term benefits, including:
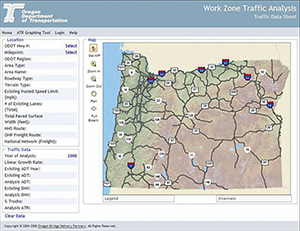 A map-centric design with GIS throughout, ODOT analysts can select the project location and other relevant information for a specific project site from the map itself, rather than find a project in one of many tabular lists stored in multiple locations.
- Improved communication,
- Integrated departmental databases,
- A move towards a services-based delivery model,
- Reduction of institutional risk, and
- Uniform tools and transparency.
What capabilities does the new WZTA tool offer?
In 2009, the revamped application went live. The resulting application looks very different from its predecessor. Now map-centric, the application provides GIS tools both up front and behind the scenes. Traffic analysts can now more easily refine their models and have a more complete view of the work zone in context with:
- Access to agency GIS layers,
- Vertical profiles generated instantaneously,
- Straight-line diagramming, and
- A collaboration environment for sharing models.
Web-based and with a relational database back-end, the WZTA tool also now supports multiple users simultaneously. The tool is currently used daily in ODOT operations.
Who are the main users of the new WZTA tool, and how do they use the tool?
ODOT traffic engineers and maintenance forces, as well as consultant traffic engineers, are the tool's primary users. These analysts use the tool to determine optimum project staging and lane closure times, as well as estimated delay to road users. In the early stages of project development, analysts run different scenarios to recommend staging options to project teams.
Analysts also use the tool when developing traffic control plans to determine optimal times for lane closures and average delay to road users. The lane closure times are incorporated into project specifications and delay reports are sent to region mobility coordinators. These mobility coordinators then use these reports to manage project delay on several key freight corridors in the state to keep average delay below levels determined by ODOT and its freight industry partners.
Basic traffic and roadway data is also available to the public through the tool's online GIS interface.
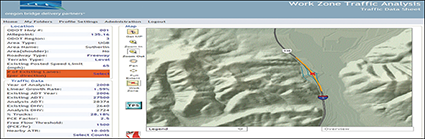 One of the GIS components of WZTA shows analysts where the work zone is and all the needed traffic data for that location, replacing the need to manually gather tabular data from multiple sources.
How has use of the WZTA tool changed the way in which ODOT uses data and how are data obtained?
The application provides time savings by centralizing all the GIS, roadway, and traffic data needed for an analysis into a single location. These data are gathered and compiled by ODOT's Transportation Development Division (TDD). TDD gathers the traffic data from statewide automatic traffic recorders and detailed traffic counts. If traffic data that represents the analysis area is not available, the analyst can upload custom data for the project.
What are the main benefits of the WZTA tool's new GIS and web-based capabilities?
GIS and web-based capabilities make the new WZTA tool more user-friendly and intuitive. Dynamic maps allow users to orient themselves to the transportation network and analyze traffic anywhere on the State highway system. Behind the scenes, geoprocessing tools create non-map geodata visualizations, producing vertical profiles and straight line maps, as designed by highway engineers.
The WZTA tool serves as a repository for information on traffic and road data, as well as past analyses that can be accessed and queried in a web browser. Because WZTA is also web-based, highway and traffic data are more easily accessible to ODOT staff and the public. Additionally, the web-based features allow qualified users to run dozens of traffic staging simulations in the time it previously took to run one.
The simulations allow ODOT to optimize and balance staging, traffic mobility, contractor efficiency, and stakeholder partnerships, thereby minimizing road user delay, maximizing safety for workers and road users, and minimizing the risk of costly contract change orders during construction.
What are the financial benefits of the application?
A report commissioned by ODOT in September 2010 characterized the WZTA tool as an “an unqualified success.” The report also concluded that during the first five years the WZTA program was online (2008-2013), its benefit/cost (B/C) ratio was 9.31:1, with 82 percent of the benefit coming from time saved by ODOT employees and contractors working for ODOT. The B/C ratio did not account for road user delay savings; the ratio would be significantly higher if delay savings had been included. Continued use of the tool will likely increase the overall benefits experienced by ODOT.
Are there any lessons learned from the redesign of this tool?
As with the development of any transportation application, communication between all interested parties is crucial. Communication and in-depth documentation of methodologies and system architecture are necessary both during development and after the application is complete. These steps allow future generations to better understand the tool and how it can be improved to meet user needs.
As GIS technologies and traffic analysis methods develop further, the tool will adapt. National research is currently underway to develop and improve work zone traffic analysis strategies and traffic simulation techniques to help traffic engineers better forecast traffic patterns. GIS will be a valuable component of those future modifications and how engineers visualize traffic forecasts.
For more information, please contact:
Eric Leaming
Email: eric.s.leaming@odot.state.or.us
Phone: 503-986-3493
The Cloud Revolution:
Editorial from Ryan Buck, Acting Executive Director of the Washtenaw Area Transportation Study (WATS)
For centuries, maps have connected the minds of cartographers with their readers. Employing our own spatial skills, we can quickly relay a significant amount of data with a few simple pen strokes or a few simple clicks of the mouse. These simple representations can connect us with complex thoughts and link us to our history. Until relatively recently, data and maps sharing has been hindered by technology compatibility issues: software, operating system or other. The ubiquity of the internet and the rise of the cloud now allow anyone with internet access simple and effective data and map creation, sharing, and storage capabilities. Geographic Information Systems (GIS) simplified the data creation and sharing process; the cloud and technologies like Google Drive are revolutionizing it.
 A deficiency map WATS developed using Google Fusion and Tables as part of their Long Range Transportation Planning process.
My office has been cautious in our use of the cloud. Even so, using the cloud-based programs like Google Drive and Fusion has increased the quality and efficiency of our work, particularly when we address questions from the public or our partner agencies. Until recently, we answered most of our transportation related data requests with a combination of Excel spreadsheets, screenshots and Word documents. We can now answer many of these same requests by creating and sharing interactive maps and supporting documentation using Google Docs. This allows us to address concerns in real time.
Google technologies have provided our small agency with a no cost option for exploring the benefits of the cloud. We are able to experiment with a number of different cloud based tools and quickly evaluate their effectiveness. The more we learn and experiment, the more we realize new ways to incorporate low or no cost improvements to our products and processes using the cloud.
However important the cloud is to map making, its most significant impact will be on the modern office. With budgets stagnating or worse, the cloud offers more flexible office solutions. No longer tethered to our desks and our intranets, we can improve the way we share data with each other and the public. Additionally, we can reduce our IT costs while freeing ourselves to access more information on the go.
This “Office 2.0” is still new and with its benefits come serious questions and concerns, not the least of which is security. This concern is real and should be carefully considered when deciding what information is appropriate to upload to the cloud. However, we are fortunate to have tools that allow us to share and collaborate in new and innovative ways and must seek to use them wisely in the face of our reservations.
For more information, please contact:
Ryan Buck
Email: buckr@miwats.org
Phone: 734-994-3127
Other News
Reports
FHWA produces reports on the use of GIS tools and applications to support transportation decision-making. Most recently, FHWA released a report called “Applications of GIS for Highway Traffic Noise Analysis.” The report provides GIS and noise practitioners with examples of noteworthy practices, considers the pros and cons of GIS applications for noise, and determines how these applications might be best used. Please visit www.gis.fhwa.dot.gov/reports.aspx to view this report.
State and Local GIS Practices Database
FHWA recently completed a comprehensive update of its database of State and local GIS transportation applications that are currently being employed across the nation. Information about each application can be found at https://www.gis.fhwa.dot.gov/gis_practices.aspx. Please visit the site to learn more or to submit information about your agency's transportation GIS applications.
Webinars
FHWA sponsors a quarterly GIS webinar series that provides information about current GIS efforts, applications, and initiatives. Planners from State Departments of Transportation (DOTs), Metropolitan Planning Organizations (MPOs), and others are particularly encouraged to attend. To view previous webinars, please see www.gis.fhwa.dot.gov/webinars.aspx.


