A Newsletter from the Federal Highway Administration (FHWA)
www.gis.fhwa.dot.gov
SPRING 2016
A New GIS User Group: The Geospatial Online Transportation User Group (GOTUG)
This quarter's Q&A is with the Geospatial Online Transportation User Group (GOTUG).
Upcoming Events
- FHWA Peer Exchange: Capabilities Maturity Models
September 20-21, 2016
Nashville, TN
In September, 2015, AASHTO announced the creation of the new user group focused on the use of web-based GIS tools among transportation planning, engineering, and GIS professionals at all transportation agencies. The FHWA GIS in Transportation Program interviewed the group's leaders, Becky Hjelm, Matt Robinson, and Rachel Roper, to provide background into the group, its goals, and its accomplishments so far. See below for the interview.
Why was the user group created? What goals do its founders have in mind?
The Geospatial Online Transportation User Group (GOTUG) was created as the next phase of the UPlan AASHTO Innovation Initiative (AII). The first phase of UPlan AII was initiated by John Thomas at the Utah Department of Transportation (UDOT) with the goal of sharing UDOT’s UPlan web-based GIS tools portal with other state transportation departments (State DOTs). John Thomas and the Utah team assisted 14 other states with piloting web mapping portals. John Farley, from the North Carolina Department of Transportation, led the second phase of the UPlan AII, which targeted another 23 states. Utah’s portal
UPlan is built using Esri’s ArcGIS Online product, but it is not the only option for states interested in creating portals. Other states have similar mapping portals built using open source.
Why might transportation professionals seek to use web-based geospatial tools?
Transportation industry use of web-based GIS tools for collaboration is growing because these tools create an easy way to access and visualize transportation data which is inherently spatial. Transportation department workforces are typically spread across a large geographic area making web tools particularly appealing. Since the first UPlan AII, web-based GIS has proven itself as both a communication and a decision- making tool.
What transportation industry needs do the group address? Who is the target audience for the user group?
The GOTUG is meant to provide a forum to exchange ideas about the future of web- based geospatial tools in transportation. The goal of the group is to bring transportation professionals, GIS, and engineering disciplines together to discuss how web-based GIS can help solve common business problems. Transportation agencies across the country face similar challenges so it makes great sense to work together toward common solutions and share lessons learned. The group is discovering that the best solutions come from collaboration among GIS professionals and key people in the various business units of the State DOTs.
How does the group encourage that sort of collaboration?
The GOTUG hosts quarterly webinars to illustrate how various groups within State DOTs are using web-based GIS tools. Launched in September of 2015, the webinars have featured ten speakers representing five State DOTs, and have touched on a variety of topics including automatic vehicle location (AVL), transportation project mapping, mobile applications, spatial analysis, and data management. The webinars have shown that regardless of the selected toolset—Commercial off the Shelf (COTS) or custom—the goal is the same. Everyone is struggling to provide cross-platform tools that can be used from any device or browser, work off-network for disconnected editing, and provide real-time data access.
Has GOTUG identified any examples of agencies that are using these tools in innovative ways?
Through the webinars, the group is able to see how planning, maintenance, asset management, environmental, traffic operations, and project delivery groups at the State DOTs are using web-based GIS tools to meet business needs. An example of this can be found in a comparison of the online project mapping applications of two states: Pennsylvania DOT’s TIP Visualization Application and Utah DOT’s UDOT Projects App. These two states have similar solutions to a common DOT business need, but Pennsylvania’s application is a completely custom development while the Utah’s is a COTS tool configured to model PennDOT’s approach.
Bringing non-technical and technical staff together was a core goal of the GOTUG and is something that sets this user group apart. Presenters are encouraged to focus on both technical and non-technical aspects of their projects during each webinar. As the webinars unfold and questions from attendees are addressed, the group finds new opportunities and uncovers barriers to future technical and non-technical GIS web development projects.
What common challenges are State DOTs facing in adopting GIS-based online collaborative platforms, and how might they address them?
State DOTs are diverse. Funding opportunities and challenges vary from state to state and the organization of GIS programs also varies widely. Some states have a centralized GIS, others are completely decentralized with greater district or local control, while some have hybrid situations with some activities centralized and others decentralized.
Despite these variations, two trends are beginning to materialize within the user group: First, the problems that many of the emerging GIS maps and applications are addressing appear common to many transportation agencies. Second, there is a growing need for change management to be considered as a part of GIS web development projects in transportation departments using geospatial technology to solve business problems. Technology is advancing at a breakneck pace, making it more important than ever to consider how State DOTs are adapting to change.
Learn More:
The GOTUG work group is organized under AASHTO’s Standing Committee on Planning and is part of the Subcommittee on Data. The goal of the group is to reach a wide audience of transportation professionals interested in leveraging geospatial web technology.
To join GOTUG, if there is a topic you wish to hear more about, or you have something you would like to share, please contact:
Becky Hjelm, UDOT, bhjelm@utah.gov
Matt Robinson, MDOT, RobinsonM21@michigan.gov
Rachel Roper, AASHTO, rroper@aashto.org
Using GIS to Map the Transportation Improvement Program (TIP) at the Madison Area Transportation Planning Board (MATPB)
Editorial from Dan Seidensticker, MATPB
The MATPB has been using GIS to map roadway and bicycle projects in the annual TIP since 1998. The mapping has evolved from black and white pen plotter maps (Figure 1) created with ArcView 2 to detailed color PDFs (Figure 2) using ArcGIS 10.3.
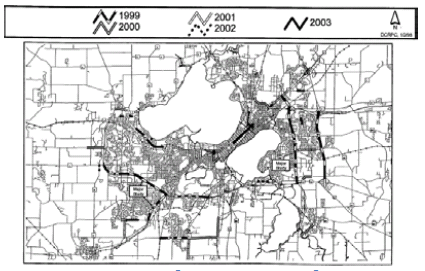
Figure 1. Madison Area Roadway Projects Map from 1999-2003 TIP
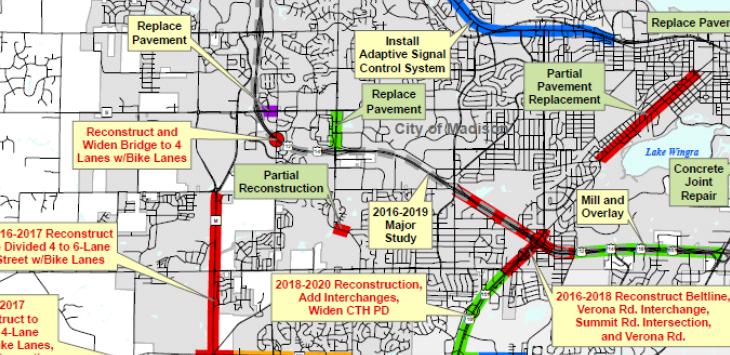
Figure 2. Portion of Madison Area Roadway Projects Map from 2016-2020 TIP
Over the last five years, the TIP projects have also been published in an interactive Web application (Figure 3) that allows the public to access more detailed information than a static PDF map can provide.
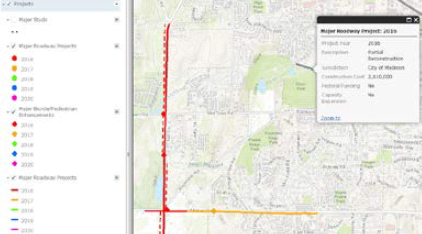
Figure 3. ArcGIS Online Application for 2016-2020 TIP
GIS is playing an ever increasing role in the decisionmaking process at MATPB. When GIS was first used for the TIP, access was limited to one user. Today, the technology is used in a collaborative effort between different MATPB staff, the results of which end up in the hands of the public.
The process begins with staff reviewing TIP applications and drawing the project limits into a local geodatabase. Projects are scored by looking at various GIS data sets that include crash records, traffic volumes, and accessibility indexes.
Draft TIP maps produced from the geodatabase are then reviewed by additional staff that revise projects as necessary. Attributes are also entered into the geodatabase for each project that include the project’s year, description, jurisdiction, construction cost, and type of funding.
When the TIP is approved, the GIS file is moved from the geodatabase into a Spatial Database Engine (SDE) enterprise database for all city and county staff to access. The SDE data is stored behind a firewall that connects to a map service served up in the ArcGIS Online Web. Advanced GIS users in the public can also connect to the map service to create custom maps.
The MATPB continues to look at developing automated tools to incorporate GIS data into the scoring process of TIP projects.
Contact Info:
Dan Seidensticker, GIS Specialist
dseidensticker@cityofmadison.com
608-266-9119
www.greatermadisonmpo.org
Other News
Uses of Geospatial Applications for Transportation Performance Management: Upcoming Case Study Report
To explore how State DOTs are developing programs around TPM and MAP-21 legislation, FHWA interviewed four specific State DOTs and developed a series of case studies focusing on their experiences. The report, will be released this Fall at https://www.gis.fhwa.dot.gov/reports.aspx.
Pennsylvania DOT (PennDOT) and Delaware Valley Regional Planning Commission (DVRPC) - Visualizing TIPs and STIPs Using GIS: Webcast Summary Available
A summary of the most recent GIS in Transportation webcast is now available on the GIS in Transportation website. PennDOT walks through the DOT’s custom GIS project application, including the STIP, and highlights some of its key features in addition to how it was developed and evolved into the main web application for the public. In the same light, DVRPC discusses how the MPO visualizes, analyzes, evaluates, and manages the organization’s TIP. This webcast summary and recording are available at: https://www.gis.fhwa.dot.gov/webinars/webinar28_penn_dvrpc.aspx
GIS for Transportation Performance Management: Peer Exchange Summary and Upcoming Case Study Report
FHWA held a peer exchange Spokane, Washington, on June 30-July 1, 2015. The exchange focused on the topic of uses of geospatial/GIS tools and applications to support effective transportation performance management (TPM). The Case Study Report will be available soon at: https://www.gis.fhwa.dot.gov/reports.aspx
The peer exchange summary, which summarizes the discussion, findings, and next steps, is available at: https://www.gis.fhwa.dot.gov/reports/Geospatial_Applications_for_Transportation_Performance_Management.aspx
GIS and the All Road Network of Linear Referenced Data (ARNOLD) Initiative: Upcoming Peer Exchange Summary
This spring, FHWA held a peer exchange on how transportation agencies are adapting to ARNOLD, including the challenges and lessons learned from doing so. A peer exchange summary report will be released this fall at: https://www.gis.fhwa.dot.gov/reports.aspx
For more information about this newsletter, please contact Mark Sarmiento, FHWA Office of Planning, at Mark.Sarmiento@dot.gov.


