A Newsletter from the Federal Highway Administration (FHWA)
www.gis.fhwa.dot.gov
SPRING 2012
A Look at the Ohio Department of Transportation's (ODOT) Asset Management Geospatial Tools
This edition's Q&A is with Andrew Williams of ODOT. He discusses ODOT's use of several geospatial tools to support asset management.
Upcoming Events
- The Washington State Chapter of the Urban & Regional Information Systems Association (URISA): 2012 Washington GIS Conference – Communicating Spatial Knowledge
May 7-9
- National States Geographic Information Council (NSGIC): 2012 Annual Conference
September 9-13
Lake Buena Vista, FL
What transportation needs existed at ODOT? How did the use of GIS help address these needs?
ODOT has one of the largest transportation networks in the country. Approximately 60 percent of all U.S. and Canadian households are located within 600 miles (a day's drive) of Ohio.
Maintaining and managing a vital transportation network with strong connections to the rest of the United States requires good planning. Over the past 30 years, ODOT has been very successful in collecting road inventory type data that includes condition assessments of its two largest assets: pavement and bridges. This has meant that ODOT was “data rich” but still “application poor.” To address this issue, the agency established a group called the Asset Management Leadership Team to lead an effort to manage ODOT's assets given decreasing preservation resources.
The Asset Management Leadership Team is comprised of many ODOT departments, including planning, maintenance, highway operations and information technology. These departments are responsible for managing or supporting assets within their respective areas.
The team approached ODOT executive management with a set of recommendations to allow the agency to develop a strategic inventory and tools to support overall asset management. The use of geospatial tools has been invaluable in meeting these needs. Specifically, geospatial tools can help address gaps in data collected as well as discrepancies that may exist between different asset inventory analysis and reporting.
ODOT's geospatial tools supporting asset management include the following:
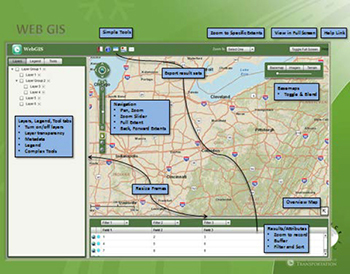 Screenshot of Web-GIS Application
- Linear Referencing System (LRS): ODOT developed a robust LRS that provides a foundation for associating the physical location of an asset to the transportation network. The LRS allows the State to use geospatial tools to support data collection and integration needed to support “back end” management systems.
- ESRI site license and tools: ODOT implemented ESRI tools through a site license to support much of its asset management activities. This license gives ODOT access to ArcGIS Server products for distribution purposes and client-based tools such ArcView and ArcInfo. ODOT is also investigating the use of ESRI mobile solutions to support additional asset collection activities.
- Web-GIS: The agency recently started a Web-GIS project that will be developed by Stantech, a private consultant. The project will leverage existing asset inventories to allow internal and external users (including the public) to view asset inventory information in a new way.
Users will be able to interact with Web-GIS to conduct spatial queries, markups, dynamic segmentation of different data sets to download into their own spreadsheets, etc. The application will be developed for both the low- and high-end user, making it easy for the first-time casual user to generate maps. A geospatial interface was chosen as a framework for Web-GIS because of the power and flexibility of the technology and because it allows for a more seamless transfer of information across multiple jurisdictional boundaries.
GIS tools have increased ease of data sharing and efficiency of integrating multiple data sets. This has allowed ODOT to move away from a “silo” database structure, which made it very difficult to integrate data or share information with partners.
When did ODOT begin to use GIS?
ODOT has been a long-time user of geospatial technology. ODOT first implemented GIS in 1980 to analyze and map crash data. Use of GIS has expanded and is now used to some degree by all ODOT business units. For example, ODOT moved to a performance-based management philosophy, establishing performance metrics and using GIS to integrate data necessary for measurements and reporting.
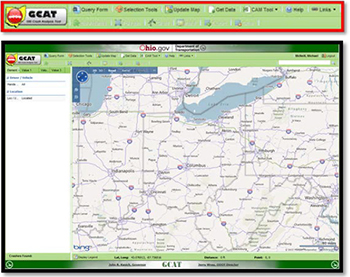 Screenshot of GCAT
What other GIS applications has ODOT developed?
In addition to the tools already mentioned, ODOT established a Base Transportation Referencing System (BTRS), the agency's first effort to develop relational databases tied to a geospatial location reference system.
BTRS was the foundation of GIS at ODOT and has been leveraged in other GIS applications such as ODOT's GIS Crash Analysis Tool (GCAT). GCAT allows internal staff and selected external staff to view crash data in a geospatial format. This type of tool has been an important component in ODOT's strategy for reducing crashes of all types by communicating information among stakeholders and across jurisdictional boundaries.
What other factors contributed to ODOT's use of GIS?
Rather than develop a “turn-key” solution for providing products, ODOT chose to direct resources towards showing the benefits of technology. ODOT also sought to coordinate and assist data owners in modifying or enhancing their respective systems to allow use with GIS applications. The first step was providing users with GIS tools as part of their standard desktop computers and then supporting users with the appropriate level of training.
Additionally, because most of ODOT's outside customers were ESRI based, the agency developed a bilingual strategy, incorporating ESRI ArcView along with GeoMedia. These tools will allow for greater access to asset data supporting management systems as they come online.
ODOT has also leveraged GIS technology for asset valuation. ODOT executive management wanted to know the value of assets along specific corridors to facilitate development of return on investment scenarios. GIS tools were used to locate assets as well as allow for buffering around certain areas.
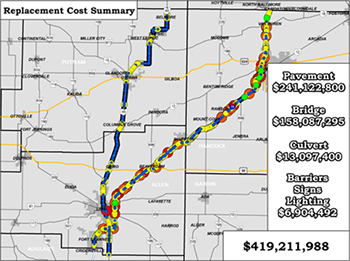 GIS Asset Valuation Analysis
This simple exercise has been very valuable in equating value to various investment scenarios when considering major funding.
How does ODOT obtain data for GIS tools?
Ohio is rich with road inventory data that dates back to the original construction of its highway system. With the development of BTRS, the data are collected and synched with the most current year's road inventory. The data are then appended to BTRS where they can be leveraged with GIS tools.
ODOT is currently developing a consolidated database with an asset management framework that will have an information technology protocol for all asset data to be brought into the database. This framework will identify the business/asset owner, a set of standards for collecting the data, and specified data formats. This collaborative effort involves the Asset Management Leadership Team, which gives all business owners an opportunity to comment on asset collection, further strengthening the process.
Who else supports ODOT's GIS efforts?
Partners from other agencies support ODOT's GIS applications. Ohio's statewide GIS group was formed to collaborate around GIS data as well as applications needed to support GIS functions.
This collaboration allows ODOT to leverage datasets from other agencies to support management of the State's transportation system.
ODOT also has a GIS users' group that meets monthly to discuss issues, concerns, and “hot topics” related to the use of GIS tools.
This group is comprised of representatives from all 12 ODOT Districts and has become a sounding board to vet ideas and discuss tough issues. Some of the issues the group has confronted are the move from one GIS application to another, development of databases and their structure, and vetting the “how” in data collection inclusive of tools.
Are there any challenges in securing funding for use of GIS?
No. ODOT executive management has committed funding for GIS tools to support asset management. GIS has been very useful for documenting and supporting the case for funding from the legislature, and as such is a part of executive and mid-level management tools used for the majority of presentations and analysis.
Are there future plans to change or modify use of GIS?
ODOT is migrating from a strictly client-based solution to a server-based GIS web portal. This portal will allow for easy database sharing and further facilitate an open data process.
Ultimately, the portal will help leverage resources and information to support ODOT's management systems and other decision support tools.
What have been the critical success factors or lessons learned?
Overall, the tools have enabled more consistent sharing of information across jurisdictional boundaries.
The most important success factor has been having executive management support. In addition, multi-departmental input is necessary to ensure that the approach meets the needs of the agency. ODOT's Asset Management Leadership Team has significantly helped to identify key issues and barriers to implementing GIS, in conjunction with the GIS users' group.
ODOT has learned that due to the ever-evolving nature of transportation, a more holistic approach to managing the transportation system is needed. This approach allows ODOT to build a better product at each stage of development, as it incorporates users into decision-making and implementation.
Another key component to a holistic approach is knowledge management. By implementing projects in this manner, ODOT staff can leverage expertise and knowledge from around the State. Information can be disseminated in a manner that not only informs but educates the users.
ODOT is moving full speed ahead with the best management tools to meet growing needs to manage the transportation system.
The public expects ODOT to leverage its resources while providing a world-class transportation system. Executive management has challenged all departments within the DOT to work towards this goal. To do this and do it well, ODOT has chosen GIS tools in conjunction with asset management techniques to meet this challenge.
For more information, please contact:
Andrew Williams
Andrew.Williams@dot.state.oh.us
Phone: 614-752-4059
A Better Tool for Managing Infrastructure
Editorial from Mehmet Secilmis, GIS Specialist, and Anand Seshadri, Bridge Engineer, Dewberry
Nearly every State and municipality in the nation is struggling with the challenge of maintaining infrastructure—including roads and bridges—while dealing with the pressures of budget-cutting and downsizing. The silver lining to this dilemma is that many governments are exploring technology-based options to save time, automate tasks, streamline decision-making, and enhance efficiency. In addressing the critical oversight of transportation inventory, GIS is clearly among the proven tools that helps meet objectives for efficiency while offering improved accuracy and management support.
The City of New Haven, Connecticut, offers a strong case in point. The city's Engineering Department required a comprehensive assessment of its bridge inventory comprising nearly 50 structures. Through GIS, Dewberry's team provided the city with much more than a static, single-use report. Instead, a comprehensive, interactive planning tool now helps staff maintain its bridge program and effectively manage infrastructure resources.
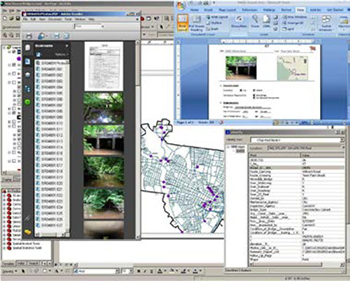 New Haven Bridge Management Tool
Users can click through to digital photography and view inter-related data in a way that would be impossible by studying stand-alone maps and spreadsheets. Aerial photos and/or U.S. Geological Survey quads of each site were used to overlay bridge locations and link data to each site. A wide range of information is available, compiled through field visits and research by structural engineers in Dewberry's New Haven office.
The available data in the tool include ownership, year of construction/ rehabilitation, inspection, history, land use, natural resources, bridge condition/rating details, maintenance/rehabilitation recommendations, and cost estimates.
Bridge conditions were prioritized and visualized, and statistical data also allowed for a comparison of New Haven's bridge infrastructure to other peer cities in the State.
The city's vision for an advanced approach to infrastructure management resulted in the creation of a “live” document that facilitates maintenance and ties in with planning of future transportation projects.
According to City Engineer Richard Miller, PE, PLS, this dynamic, GIS-based tool optimizes access to information so that “these critical bridges are managed in a forward-thinking and planned effort to ensure safe and reliable transportation linkage over time.”
Anand Seshadri, PhD, PE
Dewberry
aseshadri@dewberry.com
Phone: 203-497-3696
Other News
Reports
FHWA produces reports on uses of GIS tools and applications to support transportation decision-making. Most recently, FHWA released a report, “Best Practices in GIS-Based Transportation Asset Management,” which provides background on GIS and assessment management, describes how public agencies have been integrating the two, and identifies benefits and challenges.
This report and others are available at www.gis.fhwa.dot.gov. Please visit the site to learn more or to submit information about your agency's transportation GIS applications.
Webcasts
FHWA sponsors a quarterly GIS webinar series that provides information about current GIS efforts, applications, and initiatives. Planners from State Departments of Transportation (DOTs), Metropolitan Planning Organizations (MPOs), and others are particularly encouraged to attend. To view previous webinars, please see http://www.gis.fhwa.dot.gov/webinars.aspx.
Website
FHWA is continuously updating the GIS in Transportation website at www.gis.fhwa.dot.gov. The website offers information on GIS events, industry news, and innovative GIS applications from around the country, as well as quarterly webcasts and newsletters.
The website also includes ways to stay in touch and informed about events through an email listserv, Twitter, and an RSS feed.
To sign up for the listserv or access Twitter and RSS feed options, please see the “Connect” section in the lower right-hand corner of the website.
For More Information
For more information about this newsletter, please contact Mark Sarmiento, FHWA Office of Planning, at mark.sarmiento@dot.gov.


