A Newsletter from the Federal Highway Administration (FHWA)
www.gis.fhwa.dot.gov
November 2018
Hurricane Maria: A Challenge for GIS and Transportation
Article by Miguel Martinez-Yordan, GIS Administrator and FEMA GIS Liaison, Puerto Rico DOT
Upcoming Events
National GIS Day
November 14, 2018
Transportation Research Board’s (TRB) 97th Annual Meeting
January 7-11
Washington, D.C.
2019 AASHTO GIS in Transportation Symposium
April 23-26
Orlando, FL
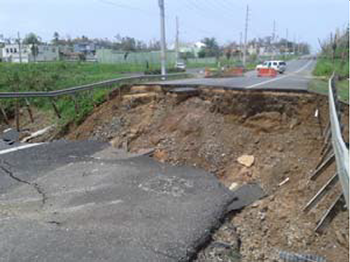
On September 20, 2017, a Category 4 hurricane swept the island of Puerto Rico leaving a trail of damage and devastation that broke the island’s entire power grid. Trees, light posts, communication cables, and tons of debris obstructed the entire road network, making travel between towns impossible. The Puerto Rico Department of Transportation (PRDOT) immediately activated the Emergency Operation Center (EOC). All emergency management personnel were activated to do field recognition and inspections on roads and bridges. Without any utilities on the island, official Transportation and County Departments were all that were available during the first month. After the hurricane, hundreds of maps were printed weekly for the field operations assessments and rescue missions. These maps gave direct support to all agencies involved in recovery efforts, as they were the only tool available. The Federal Emergency Management Agency (FEMA) established their own EOC, called the Joint Field Office (JFO), in the San Juan Convention Center and gathered every unit and division from FEMA, the Department of Defense (DoD), and multiple State and other Federal agencies.
| Roadway |
KM |
Municipality |
Incident No. |
Description |
Photo |
| 111 |
13.1 |
San Sebastián |
KT-4 |
Bridge #1733 |
|
Figure 1: Example of an incident-record, identified using Linear Referencing System (LRS)
PRDOT immediately assigned personnel to assist with road and bridge inspections and provided support to the FEMA GIS unit. State road datasets were updated and made available to all FEMA personnel to locate all reported events with precision. Between latitude and longitude coordinates and kilometer posts, reported events were located and pinpointed on maps for the emergency operations. The PRDOT Linear Referencing System (LRS) dataset was the primary source of information to locate events reported by the public to the JFO. Even after the hurricane, many kilometer posts remained standing in the field. The public used the kilometer posts to report all kinds of situations in their neighborhoods and in areas where there were no GPS communications to record coordinates. Through this method, a total of more than 7,000 incidents were reported to the PRDOT EOC alone.
ArcGIS software was used to locate, analyze, and create multiple solutions to assist different operation missions throughout the island. ArcGIS Online provided locations and event reports, and services were shared with all operation units. Survey123 for ArcGIS was used to build multiple digital worksheets to collect field data surveys from events and people affected by the hurricane. The Puerto Rico Planning Board was a leader in the creation of Survey123 worksheets, mainly for the Centers for Disease Control and Prevention. ESRI local distributor, Geographic Mapping Technologies, gave direct support with free licensing and personnel to assist in everything ESRI related. Hexagon Geospatial also supported the emergency by making available recent aerial imagery for the whole island to use in before-and-after analyses. Other State agencies like the PR Police Department, the Office of Management and Budget, and the Municipal Revenue Collection Center assigned personnel to the GIS unit for local support.
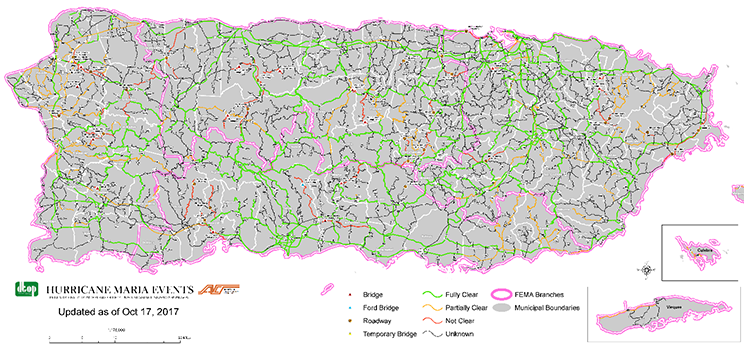
Figure 2: Detailed map of PRDOT’s incidents as of October 17, 2017
In the end, hundreds of datasets were updated by use of aerial imagery and the collaboration between the State and Federal Government and the private sector, in a GIS joint venture to assist the biggest emergency operation event in the history of Puerto Rico.
Multiple lessons emerged in terms of the geographic data necessary to deal with an event of this magnitude. First, paper maps must be available in the event of a faulty power grid. Second, a good LRS dataset is needed to assist the public in the case of a malfunctioning communications system. Third, landing zones must also be identified through aerial imagery all over the territory for rescue missions. Fourth, local sectors must be well identified to guide external personnel in reaching places in a timely manner. And lastly, a public roads network must be well attributed and accessible to all emergency operation personnel to establish operational routes to assist in the deployment of first-necessity materials for affected communities.
The Internet of Things (IoT) for GIS in Transportation
Editorial by Suchi Gopal, Professor at Boston University
Our guest editorial writer is Professor Suchi Gopal, who teaches GIS and spatial analysis courses in the Department of Geography at Boston University. Professor Gopal’s GIS projects span a wide range of applications, including assisting State and town police in analyzing spatial patterns of highway accidents to demonstrate the issues around positional accuracy and interoperability. She also applied these techniques in researching bicycle accidents on campus. Another project of hers examines the accessibility of health services in Kenya to HIV-positive pregnant women. Her work focuses not only on mapping physical variables such as road networks, but also on the more difficult task of modeling multimodal spatio-temporal accessibility measures. Her project analyzing China’s massive transnational Belt and Road initiative (to link 68 countries in Asia, Africa, and Europe with a network of highways, railways and pipelines) tackles the difficult challenge of designing data models that are flexible enough to handle huge datasets from many countries, accommodate different data formats and resolution, and ensure high-performance in analysis and both static and dynamic visualization. She is now working on the Carbon Free Boston project, which seeks to identify ways Boston can become carbon neutral by 2050. Professor Gopal holds a PhD in geography from U.C. Santa Barbara, as well as multiple masters and bachelor’s degrees in geography from Madras University in India.
GIS for transportation is experiencing technological innovations with an increasing use of wireless communication, which is the cornerstone of smart city and smart transport (IoT). This technology offers significant benefits in terms of traceability, adaptability, real-time monitoring, and efficiencies in transportation. R&D is needed to combine geospatial functionalities with transport modeling while providing an efficient, interactive, visual interface for data exploration, manipulation, analysis, and visualization. Transportation agencies are beginning to tackle such issues and may provide scalable solutions.
The Internet of Things (IoT) refers to the use of large-scale wireless sensor network (WSN) technology. This technology permits sensor-based information connection and exchange between physical devices, vehicles, trains, planes, buildings, streets, and other items embedded with electronics, software, sensors, actuators, and connectivity. Any discussion of IoT in the context of GIS for transportation involves the issue of spatio-temporal data representation and storage. The preferred option for IoT data analytics is the cloud (e.g., geospatial Python), far different from current practices of storing geospatial data (e.g., ESRi shapefile, GeoJSON formats along with relational database such as PostGIS).

Figure 3: Figure depicting the interrelation of everyday objects connected to the internet
The collection and storage of large volumes of sensor tracking data at finer spatio-temporal resolutions has led to “big data” problems of representation and management of dynamic data of moving objects (people, vehicles, fleet management, and shipments). Big data tools that offer geospatial capabilities are emerging (for example, ESRI’s GP tools, Elasticsearch, and RedShift). ESRI now offers GeoEvent Server that can deal with high-velocity and real-time data as well as the big data storage and GeoAnalytics Server that are appropriate for IoT applications in GIS for transportation. A variety of applications exist that show the benefits of the transport IoT, including online monitoring of traffic, travel times, smart transport systems, transportation logistics, supply chain management, sustainable transport, parking, GPS tracking, and location-based social networking.
For example, smart connected fleet management solutions are estimated to cover 90 percent of the total market by 2020. Many cities have already adopted smart parking and traffic management systems. Consumers’ use of traffic and parking apps on their smart phones shows the ever-increasing adoption of smart technologies impacting transportation across the Nation. Thus, IoT for GIS in transportation has enormous potential to yield social, health, energy, and environmental benefits.
Other News
National GIS Day is November 14. Visit the GISday website for more information on events happening near you.
Reports Available
Data Governance & Data Management: Case Studies of Select Transportation Agencies
This new case study report explores how State Departments of Transportation (DOTs) currently define and apply the concepts of data governance and data management. Four State DOTs were interviewed for this effort (Arizona, Arkansas, Ohio, and Texas) to ascertain the current and planned levels of implementation, and to obtain feedback on what the Federal Highway Administration can do to facilitate the development of these processes.
Geospatial Information System Capability Maturity Models: Case Studies of Select Transportation Agencies
A new case study report highlighting four State DOTs and how they use the URISA Capability Maturity Model to assess their organizational maturity is now available on the Federal Highway Administration’s website.
Coming Soon
Peer Exchange on Data Governance
In September, Arkansas DOT hosted a Peer Exchange organized by the Federal Highway Administration. The exchange focused on ways to pursue data governance strategies within State DOTs, with a focus on policy, staffing and personnel structures, and technology. A summary of this peer exchange will be made available on this page: https://www.gis.fhwa.dot.gov/reports.aspx.
Keep an eye out for the GIS in Transportation program at GIS-T in April of 2019, in Orlando, Florida.
For more information about this newsletter, please contact Mark Sarmiento, FHWA Office of Planning, at Mark.Sarmiento@dot.gov.


