A Newsletter from the Federal Highway Administration (FHWA)
Printer-friendly PDF →
May 2021
Spotlight: Upcoming Case Study Reports from FHWA’s GIS in Transportation Program
The Federal Highway Administration’s (FHWA) GIS in Transportation program regularly publishes case study reports highlighting the use of GIS at State Departments of Transportation (DOTs), metropolitan planning organizations (MPOs), and other agencies. Each case study report features examples of innovative geospatial technology, collaborative partnerships, and successful implementation strategies to further agencies’ broader transportation goals.
Over the past several months, the GIS in Transportation team has been developing two case study reports. Below are highlights from these research efforts. Both case studies will be published later this year.
Improving Safety with Crowdsourced Data
This case study will explore how State and local agencies are using crowdsourced GIS data to improve safety for drivers, cyclists, pedestrians, and users of other transportation modes. Crowdsourced data is primarily generated in one of two ways: (1) actively by users, for example, when a user writes a review or uses an app to plan or track a trip; or (2) passively, such as when a mobile device collects the user’s location in the background. This type of data is generally gathered by private technology and software companies.
Crowdsourced data is a powerful tool for understanding trends across geography and time. Many potential use cases are of interest to transportation agencies. For example, crowdsourced data can help agencies understand current and historical traffic trends, including speed bottlenecks, hazardous parking, speeding, and congestion, to increase roadway safety and alleviate congestion. Agencies can also use crowdsourced bicycle and pedestrian data to identify design problems with certain roadways or intersections and prioritize investments based on bicycle and pedestrian traffic patterns. Agencies can provide real-time feedback to drivers, bicyclists, and pedestrians using navigation apps to address roadway incidents in real time.
The GIS in Transportation team spoke with individuals at five agencies that have used crowdsourced data for various purposes:
- Iowa Department of Transportation
- Kentucky Transportation Cabinet
- Oregon Department of Transportation
- City of Boulder, Colorado, supplemented by the Denver Regional Council of Governments
- Mid-Ohio Regional Planning Council, supplemented by the Ohio Department of Transportation
The agencies’ projects range from using real-time crowdsourced data to monitor current conditions and traffic-related events; to providing real-time information to roadway users; to integrating crowdsourced data into long-term planning processes, including bicycle and pedestrian planning. The team has concluded interviews with the agencies listed above and plans to publish a report on their findings later this year.
Asset and Performance Management at State DOTs
This case study will explore the current state of the practice in asset and performance management for State and local agencies using GIS. This case study will also discuss notable practices and lessons learned that transportation agencies could use to advance GIS in these areas.
Performance management is a strategic approach that uses system information to make investment and policy decisions to achieve national performance goals. Asset management is the application of this approach to manage the condition of the infrastructure assets that are needed to provide for mobility and safety on the Nation's transportation system. In short, asset management is the engine that drives infrastructure performance. GIS enables agencies to link performance areas and performance outcomes together, examining the relationships between investments and improved outcomes.
Transportation agencies can use GIS to visualize locations with issues related to roadway asset condition and performance areas such as safety, congestion, air quality, and goods movement (freight); agencies can also use GIS to identify which investments could address those concerns. Agencies can then prioritize their resources to use them as effectively as possible, ideally monitoring how potential investments impact their performance goals in each area.
The GIS in Transportation team interviewed individuals at the following agencies about their use of GIS in asset management and performance management:
- South Dakota Department of Transportation
- Ohio Department of Transportation
- Idaho Transportation Department
In each case, DOT staff describe the data collection, governance, reporting, visualization, and collaboration that enables them to use GIS to advance their asset management and performance management goals. With interviews completed, the team is drafting the report and intends to publish it later this year.
Field Data Collection for Damage Assessment
Editorial by Sarah Linn, Maintenance GIS Coordinator, Vermont Agency of Transportation
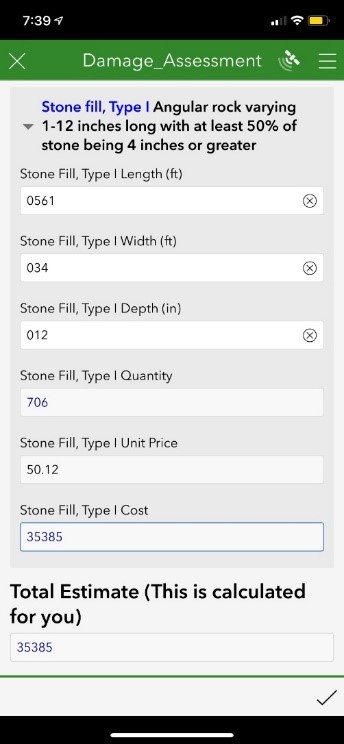
Figure 1. Illustration. Screenshot from the damage assessment mobile data collection app. Source: VTrans.
Sarah Linn has 15 years of experience working in the GIS field, from data collector to tech support to GIS Administrator. She currently works for the Vermont Agency of Transportation in the Maintenance Division as the GIS Administrator.
The Vermont Agency of Transportation (VTrans) relies heavily on several GIS applications to quickly provide estimates of roadway infrastructure damage directly following a storm event. This data is used by decision makers to determine whether a gubernatorial proclamation or presidential declaration will be declared based on the results.
Trained VTrans staff use the Survey123 application to assess the damage (see figure 1). Once submitted, that data runs through various Python coding processes. Functional classification is used to determine whether a damage point falls on a FEMA- or FHWA-eligible highway. This data is then displayed on an ArcGIS Dashboard for easy viewing by various decision makers, including the governor’s office (see figure 2). The storm damage data is also used in collaboration with a road closure application to help the public determine safe traveling after a storm.
The greatest challenges in building this process were to identify the many different types of users with varying GIS skills and to build GIS tools that could be useful to all of them. Further, it took time and energy to train users and build their confidence and investment in the applications. The project team trained hundreds of users over a 5-year period. The process is now being applied efficiently with strong positive benefits.
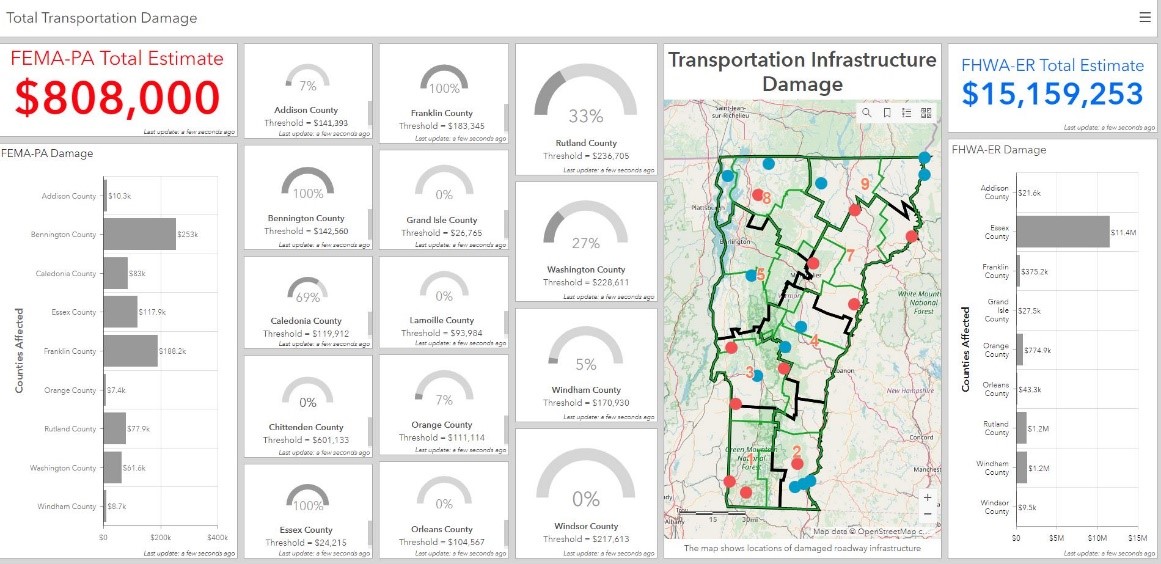
Figure 2. Illustration. VTrans’ Transportation infrastructure damage dashboard. Source: VTrans.
Other News
Newly Available
Peer Exchange Report on Data Dashboards
This newly available peer exchange report provides highlights from our fall peer exchange, which focused on how agencies can leverage GIS platforms to track performance and deliverables on data quality control, asset management, performance management, and more. The peer exchange emphasized the importance of GIS data dashboards as effective tools for conveying vital information to both internal and external stakeholders. To read the report, visit:
https://www.gis.fhwa.dot.gov/reports/Data_Dashboards_Peer_Exchange_Oct2020.aspx.
Using GIS for Data Dashboards Webinar Summary
In this webinar, representatives from Oregon DOT (ODOT) presented lessons learned from the development and implementation of OTSDE, the Oregon Transportation Safety Data Explorer. OSTDE is a publicly accessible, web-based GIS tool ODOT created for safety and multimodal work at the DOT. It helps users see connections to leverage efforts across multiple DOT programs using ESRI Web AppBuilder functionality. OSTDE’s user interface does not require ArcGIS skills to view and filter crash data, crash screening data, and active transportation data, making it a critical and highly accessible tool for the DOT. To read the webinar summary, visit:
https://www.gis.fhwa.dot.gov/webinars.aspx.
State of Vermont Right-of-Way Webinar Summary
In this webinar, representatives from the Vermont Agency of Transportation (VTrans) discussed their efforts to develop a statewide property parcel data layer. Peer presenters Johnathan Croft, VTrans Mapping Section Chief, and Mary Haley, VTrans Right of Way Section & Survey Unit GIS Professional, described how the project has advanced the mission and goals of the agency. They also explained the specific steps they took to bring the project to fruition: from the initial enabling legislation, collaboration with agencies and departments, developing parcel standards, parcel data creation through vendors, issues experienced during the project, the Grand List, how this information is being used at VTrans, and transfer of the project to a program at the Vermont Center for Geographic Information (VCGI). The recording is now available on the GIS in Transportation homepage, and the webinar summary is available at
https://www.gis.fhwa.dot.gov/webinars.aspx.
Past Events
GIS for Transportation Symposium
The 2021 AASHTO GIS for Transportation Virtual Symposium took place from April 19 to April 22, 2021. Since 1989, the symposium has brought together persons in government and private industry who are interested in the use of GIS for transportation purposes. Originally scheduled to be held in Minneapolis, MN, the symposium was offered in a virtual format. A link to symposium materials is available on the GIS in Transportation homepage:
https://www.gis.fhwa.dot.gov/.
Coming Soon
As mentioned above, the following reports will be available soon at this page:
https://www.gis.fhwa.dot.gov/reports.aspx:
- Case Study Report on Improving Safety with Crowdsourced Data
- Case Study Report on Asset and Performance Management at State DOTs
For more information about this newsletter, please contact Mark Sarmiento, FHWA Office of Planning, at Mark.Sarmiento@dot.gov.


