A Newsletter from the Federal Highway Administration (FHWA)
www.gis.fhwa.dot.gov
MARCH 2015
Long-Range Transportation Plan for the Boston Region Metropolitan Planning Organization: Interactive Web Mapping Tool for Needs Assessment
This edition's Q&A is with Mary McShane of the Central Transportation Planning Staff (CTPS), who provide technical support to the Boston Metropolitan Planning Organization (MPO). She discusses CTPS' development of an interactive web mapping tool to support the Boston Region MPO's latest Long-Range Transportation Plan (LRTP).
Upcoming Events
- AASHTO GIS for Transportation Symposium
April 19-22, 2015
Des Moines, IA
See gis-t.transportation.org/
- American Society for Photogrammetry and Remote Sensing (ASPRS) 2015 Annual Conference
May 4-8, 2015
Tampa, FL
- Esri User Conference
July 20-24, 2015
San Diego, CA
- NSGIC 2015 Annual Conference
October 5-9, 2015
Kansas City, MO
- URISA GIS-Pro & NWGIS 2015 Conference: Geography at the Nexus of Collaboration
October 18-22, 2015
Spokane, WA
The LRTP, produced every four years, provides the rationale for future transportation investments in the Boston Region MPO. The Boston Region MPO covers approximately 1,405 square miles, and includes 101 cities and towns. The MPO governing body has 22 voting members including state agencies, regional entities, and municipalities. Development of the LRTP involves extensive interaction between MPO members and the MPO staff charged with developing LRTP support materials.
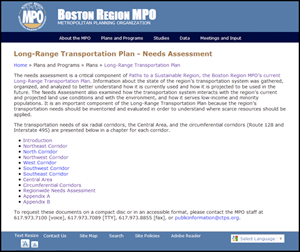 Figure 1: Screen Capture, 2011 LRTP Needs Assessment with Links to PDFs
How did your agency display and evaluate data in the past?
The LRTP currently in force was approved in September 2011; it includes a Needs Assessment section, which was created in portable document format (PDF). This document used Esri mapping tools to create GIS maps featuring data on current and projected socioeconomic characteristics, current and projected demands on the transportation system, and environmental and other constraints in the region. Most of the transportation data were developed by CTPS or the Massachusetts Department of Transportation (MassDOT); data on environmental constraints were obtained from MassGIS, the statewide clearinghouse for GIS data; socioeconomic data inputs were provided by the Metropolitan Area Planning Council (MAPC), and subsequently modified by CTPS. Maps displaying these data were embedded in explanatory text and analysis, and used to prioritize transportation needs in the Boston Region MPO. Based on these identified needs, as well as public input, funding considerations, and other factors, the MPO recommended projects and programs to be advanced.
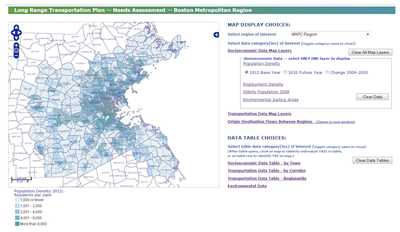 Figure 2: Screen Capture, 2014 Application Displaying Population Density Data
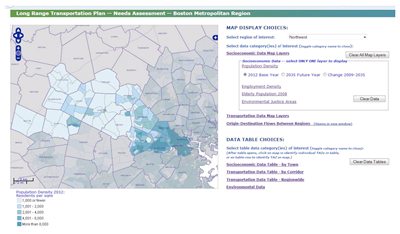 Figure 3: 2014 LRTP Application Zoomed in on Northwest Corridor
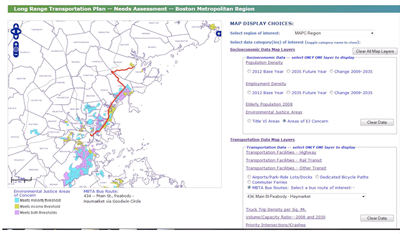 Figure 4: Selected Bus Route Displayed Against Regional Environmental Justice Areas of Concern
How did your agency decide to display and evaluate data for a new LRTP?
For the new LRTP—which defines transportation needs and priorities through 2040—CTPS decided to offer the Needs Assessment information in an interactive, online mapping, and data retrieval tool. CTPS developed the tool in-house, and made it accessible to all MPO members and the general public. The goal is to allow users to select the data they want to display and to manipulate the data in a way not possible with printed or static maps.
How did your agency develop the application, and what are its capabilities?
Data layers were created using ArcMap and exported to Arc Spatial Database Extension (ArcSDE), backed by an Oracle database. The ArcSDE layers were then published using GeoServer. The Web application itself was created using HTML/CSS and Javascript, with OpenLayers used to publish data on the application via requests to GeoServer. Layer styling was accomplished using Styled Layer Descriptors (SLD), based on Extensible Markup Language (XML). All of these tools, except for the ESRI tools (ArcMap, ArcCatalog, and ArcSDE) and the Oracle database, are open-source mapping tools.
Users may view data for the region as a whole (Figure 2), or zoom in to see specific corridors or towns, such as the Northwest Corridor shown in Figure 3.
Users can choose to display the following information:
- Socioeconomic data (population, employment, and household forecasts by Traffic Analysis Zone (TAZ); and areas for special consideration under Title VI or Environmental Justice requirements).
- Transportation resource and performance data (major roadways, rapid transit, commuter rail and MBTA bus services; airports, ferry ports, park-and-ride lots, and dedicated bicycle trails; existing and projected speeds and volume-to-capacity ratios on major roadways based on output of the Regionwide Traffic Model; intersections identified as ‘critical locations;’ and locations of crash clusters that rank highest on a scale of injury and property damage).
Users may choose to display multiple layers from the two main categories simultaneously in order to make their own evaluations (Figure 4).
In addition to the maps, the application also provides tabular data, which allows users to retrieve data in the categories displayed and to download the tables as comma-separated or Excel files for use on their own computers.
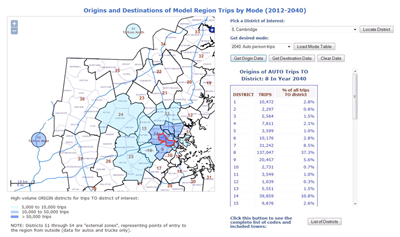 Figure 5: Origin-Destination Data Page—Origins of Auto trips to Cambridge, MA (District 8)
Data on traveler origins and destinations is provided on two separate screens: One shows origins and destinations between each district and every other district in the region, including external zones, for the base year, future modeled conditions, and all modes including trucks (Figure 5). The other screen focuses on trips destined for the Boston central area and Boston core, tabulated for all modes except trucks (Figure 6).
What challenges did your agency face in developing this application?
Development of this tool was challenging for several reasons, including:
(1) The sheer quantity of data to display.
The current version of the tool allows users to click on 35 data layers, and presents the capability to zoom in on eight corridor definitions. Staff were particularly concerned about users from the general public, who may have slow Internet connections and may be using antiquated browsers that cannot easily or quickly display voluminous mapped data. One strategy was to minimize the number of discrete geographic layers by referencing all applicable attributes in a single geometric layer using different style descriptors for display. In addition, modifications were made to pages using Scalable Vector Graphics (SVG), which cannot be seen by Internet Explorer 8 and earlier browsers. The application also includes a warning concerning the limitations of particular browsers.
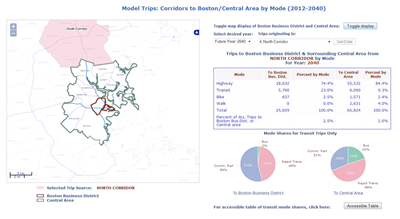 Figure 6: “Trips to Boston Central Area” Data Page—Breakdown by Mode of Trips from Northern Corridor
(2) Accessibility to vision-impaired or mobility-handicapped users.
Providing accessibility to special user populations is a requirement that cannot easily be met for mapped data. This was one reason for also including the data tables, which were made accessible to the extent possible. All pages were tested for navigability and table readability using the JAWS (Job Access With Speech) screen reader. But there are limits as to what is possible. CTPS regional models use a transportation analysis zone (TAZ) network with 2,727 TAZs, more than 400 of which are within the City of Boston—how can a blind person distinguish the locations of individual TAZs without being able to see them?
(3) Symbology ‘niceties’ of ArcMap that are difficult to carry over into the GeoServer/OpenLayers environment.
Chief among these were:
- Setting symbol hierarchies/order of drawing symbols so that these don't overlap.
- Use of offset lines to represent directional roadways so that, for example, northbound and southbound speeds can be shown using the same road linework.
The web application was launched in November 2014, and so far has met with approval from MPO members. Most staff who develop these applications in house are not primarily programmers, and the learning curve is steep and challenging. However, the application is considered to be a worthwhile investment given that this type of Web-based interactive data display using GIS is clearly the way of the future. CTPS intends to extend and modify this application for subsequent editions of the LRTP.
The application is available here: https://www.ctps.org/.
For more information, please contact:
Mary McShane
Email: MMcShane@ctps.org
Phone: 617-973-8006
A Retrospective Look at Tools & Technology
Editorial from Thomas Martin, Data Application Manager, Minnesota DOT (MnDOT)
MnDOT developed its first field data collection tool for HYDraulic INFRAstructure (HYDINFRA), a statewide hydraulic infrastructure information application, in 1991. GPS technology at this time was burdened by Selective Availability (SA), an intentionally introduced error into the accuracy of the signal intended to prevent enemy use of GPS receivers for weapon guidance. In order to correct for SA, those collecting data had to post-process the data, increasing the time investment per record and adding to the complexity of data collection. Metadata fields became the answer to ensure a wide variety of data collection tools could be used. These tools ranged from survey quality GPS to point and click on geo-referenced USGS quad maps. Without metadata to categorize asset location, end-users would have had trouble interpreting the usability of the location.
As unit costs decreased, GPS equipment became more available, and SA was deactivated by Presidential decree, these locating issues became moot. However, the metadata fields used to indicate accuracy of GPS field data collection tools became important data details for MnDOT as HYDINFRA matured. While today's data can be collected to an accuracy of ± one meter due to technological and infrastructure advancements, the quality and relevance of the data collected during the initial phases of MnDOT's asset management effort remain pertinent. These fields have become subtle details within the data model that have extended the usefulness of the historic data and continue to support a suite of tools that play an important role in MnDOT's asset management efforts.
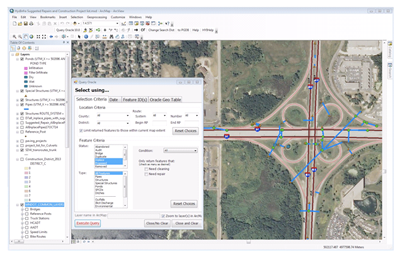 HydInfra Query Tool with I94-494 Interchange Aerial
It is amazing that the development of a suite of tools that involves databases, spatial components, reporting and analytic tools, and field data collection technology has remained useful, practical, and efficient for MnDOT. Just as amazing is the agency's continued support and efforts toward this enterprise (no small credit can be given to the application manager, trainer, primary support staff and continuity team). Not one of the original team members could have foreseen the depth and breadth of the changes that have taken place in the past 20 plus years. These changes included the phasing out of SA and the changing of the agency's application and database standards. Most importantly, the passing of Moving Ahead for Progress in the 21st Century (MAP-21) mandated state governments develop Transportation Asset Management Plans for their States.
HYDINFRA is a fine example of what a well-thought-out data model, well-crafted tools, and a bit of pushing the current state of technology can provide agencies the future. In a sense, MnDOT purposed its Hydraulic Infrastructure program to today's federally mandated standards.
For more information, please contact:
Thomas Martin
Email: Thomas.Martin@state.mn.us
Phone: 651-366-4097
Other News
Making a Business Case for GIS: Upcoming Peer Exchange and Report
FHWA sponsors peer exchanges, in which GIS practitioners gather to share and learn about existing effective practices, methodologies, and lessons learned concerning the use of GIS to support transportation decision-making. This spring, FHWA will be holding a peer exchange on how transportation agencies are making the business case for GIS applications or geospatial tools, such as:
- Collecting data on agencies' GIS activities that illustrates business practice improvements
- Quantifying the benefits of geospatial tools
- Documenting GIS cost-benefits
- Developing GIS Return on Investment (ROI) analyses
- Demonstrating improved decision-making processes as a result of strategic GIS investments
A case study report based on the peer exchange discussion, as well as case study interviews conducted with each participating organization, will be released next fall at www.gis.fhwa.dot.gov/reports.aspx.
Regional Models of Cooperation: Upcoming Case Study Report
This spring, FHWA will be conducting case study interviews with agencies that are using GIS to enhance multijurisdictional cooperation. This effort is associated with the FHWA Every Day Counts (EDC) Regional Models of Cooperation initiative (more information available here www.fhwa.dot.gov/innovation/everydaycounts/edc-3.cfm). This report will be available next fall at www.gis.fhwa.dot.gov/reports.aspx.
Geospatial Data Sharing: Reports Now Available
FHWA recently published three reports that explore how State Departments of Transportation (DOTs) and other transportation agencies are developing and using geospatial tools to support increased collaboration and improved information-sharing.
These objectives are associated with the Federal Highway Administration's (FHWA) Geospatial Data Collaboration (GDC) initiative (www.gis.fhwa.dot.gov/gdc.aspx), which encourages State DOTs and others to use geospatial tools to streamline and improve transportation decision-making.
For more information about this newsletter, please contact Mark Sarmiento, FHWA Office of Planning, at Mark.Sarmiento@dot.gov.


