A Newsletter from the Federal Highway Administration (FHWA)
www.gis.fhwa.dot.gov
JANUARY 2015
Pennsylvania Department of Transportation's Snow Routes and Planning Process with GIS
This edition's Q&A is written by Sandra Tosca, P.E., District Executive for Engineering District 3-0, at the Pennsylvania Department of Transportation (PennDOT). She discusses PennDOT's GIS-based Snow Route Planning Application and how the agency is using the application to assess its winter operation policies and practices.
Upcoming Events
- Transportation Research Board (TRB) Annual Meeting
January 11-15, 2015
Washington, D.C.
- Esri Federal GIS Conference
February 9-10, 2015
Washington, D.C.
- NCGIS2015
February 25-27, 2015
Raleigh, NC
- AASHTO GIS-T Symposium
April 19-22, 2015
Des Moines, IA
- American Society for Photo-grammetry and Remote Sensing (ASPRS) Annual Conference
May 4-8, 2015
Tampa, FL
What transportation needs existed at PennDOT?
In 2012, PennDOT formed teams to identify process improvements, operational improvements through technology, and other cost saving initiatives. One of these teams, the winter operations assessment team, quickly identified significant data gaps which hindered the team's ability to complete their assessment. Specifically, the team needed additional data to better assess the following:
- Department force truck fleet size and usage compared to the 2003 truck allocation formula
- Rental and other agreements with municipalities and agencies used for winter services
- Truck coverage of the roadway network
- Types of plows and spreaders attached to trucks
- Deployment of specialized winter service equipment (dual wing and tow plows)
- Planned service cycle times for each roadway network
- Material application rates used on each snow route
- Material mixes used on each snow route
- Designated anti-icing routes and application strategy
At the same time, a GIS team noted that the largest volume of maps produced by the engineering districts were snow maps used to identify truck routes. This team also identified snow maps as the most cumbersome project for GIS operators because of the need to reconcile erroneous location references. In addition, there was no way to develop statewide maps that could be used to identify routing efficiencies across county lines.
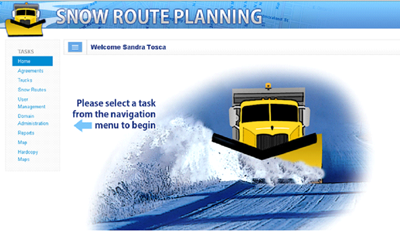 Figure 1: Snow Route Planning Application.
How did PennDOT address these challenges?
During the summer of 2013, PennDOT and a contractor developed and deployed a GIS-based Snow Route Planning Application to address both data gaps and snow mapping issues. This application used data from existing systems for location referencing, bridge conditions, and equipment inventory. To achieve uniformity in planning, especially across key corridors, PennDOT Headquarters requested all districts/counties enter the required winter service information into the application, using a spreading storm with temperatures of 25 degrees and rising as a guide. Historically, 25 degrees and rising is Pennsylvania's most prevalent winter storm condition.
Required winter service information included the routing of each truck, planned cycle time, materials used, application rates for materials, pre-wet information, location of anti-icing and application rate, types of plows and spreaders attached to the truck, agreement numbers, and expiration dates for agreements.
The application was developed by a contractor, Geo-Decisions, at an initial cost of $99,000 in 2013 and an additional cost for enhancements at $77,000 in 2014. District staff developed the majority of reports mining data from the application, which helped in controlling costs.
How was the Snow Route Planning Application used by PennDOT?
Initially, the Snow Route Planning Application was used to generate the Snow Routing Maps needed for winter services. Several GIS operators noted that this process significantly simplified the development of snow maps, reducing map development time from two weeks to two days. Once the mapping was complete, a small team of district staff began analyzing the data captured in the application, looking for winter service gaps and inconsistencies across the state.
In addition, a team comprised of district and central office staff evaluated the department's winter dump truck fleet to determine whether they were optimally deployed for winter services. The GIS Snow Route Planning Application provided significant information that was not previously available to complete this statewide analysis.
Reports and metrics generated from the Snow Route Planning Application were used to assess each of the 11 engineering districts. Each assessment focused on the following:
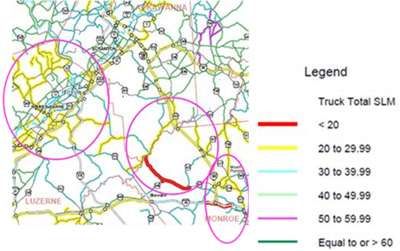 Figure 2: Example of using GIS maps to help optimize routing of trucks with low snow lane mile assignments. Map identifies truck assignments by snow lane mileage thresholds.
- Ranges of service cycles
- Time study results compared to planned service cycle
- Use of the dump truck fleet (Figure 2)
- Recommended size of the dump truck fleet
- Management of the rental trucks
- Gaps and overlaps in the service routes
- Number and coverage area of winter stockpiles
- Anti-icing routes and application rates (Figure 3)
- Material mixes and application rates (Figure 4)
- Inventory of plows and spreaders compared to use
- The assigned locations of specialized equipment (dual wing and tow plow)
- Opportunities to improve routing efficiencies
These assessments were the starting point for discussions concerning statewide inconsistencies in planning and managing winter operations. In addition, the assessments were used to gauge the basic knowledge of terms, policies, and practices used in winter operations.
The assessments made use of both summary reports at the executive staff level and detailed reports at the operational level to identify outliers and focus areas. These reports were complemented by GIS maps which provided clarification and emphasis. The assessments identified a number of items that PennDOT clearly needed to take action on, including:
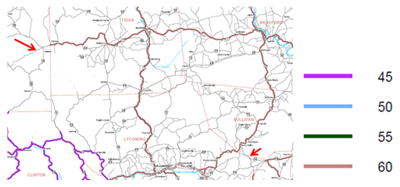 Figure 3: A portion of the statewide anti-icing map to assess corridor consistency.
- Create policies to provide uniform treatments on key corridors (material mixes, application rates, and anti-icing route selection)
- Develop training that clearly communicates expectations and basics of winter operations
- Optimize snow routes to reduce trucks in a methodical, data driven manner
- Publish guidelines on consistent material mixes and application rates
- Normalize extreme variances in cycle times
- Develop an anti-icing network
- Improve rental truck management
- Evaluate the location and number of winter stockpiles
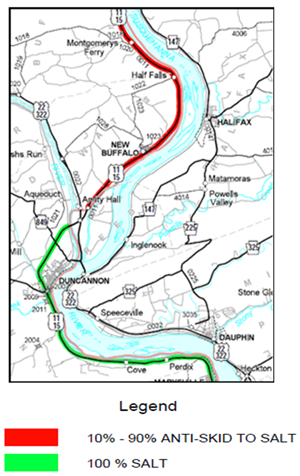 Figure 4: Example of using GIS maps to assess the consistency of treatment on primary corridors by planned materials mixes.
As a result of the assessments, several updates to policy manuals and training programs for winter services are currently underway. A number of county maintenance managers have also started to optimize snow route assignments, change winter management strategies, and evaluate opportunities for savings. Staff presented to executive staff in August 2014. Subsequent to this presentation, each of the 11 engineering districts were required to identify at least one objective that would reduce cost or improve efficiencies in winter operations. In November 2014, districts identified the potential for $1.5 million to $2.4 million in savings during state fiscal year 2014-15. Several areas of potential savings included:
- Reduction in winter material application rates
- Changes in winter material mixes
- Reduction of surplus plows and spreaders
- Reduction in temporary personnel
In addition, several districts plan to further evaluate snow route assignments and have already identified the potential to reduce department force and/or rental trucks during operations next year that could generate several million dollars in savings.
Sandra Tosca, P.E.
Email: STOSCA@pa.gov
Phone: 570-368-4200
Emergency Response in Larimer County, CO: Rapid Development When Disaster Hits
Editorial from Will Allender and Drew Davis, Larimer County, CO
In an ideal world, application developers would know every use case and every functional requirement for every type of emergency. Enterprise and desktop systems could be seamlessly integrated with field solutions and we could build robust applications, where users have all the information they need at their fingertips. Unfortunately, we cannot predict everything, and technology is constantly changing. People who work on emergency response IT projects need to think on their feet and have a wide collection of skills to support web, desktop, enterprise, and mobile solutions.
In 2013, Colorado suffered devastating flooding that washed away many sections of roadway. After the initial search and rescue operations and subsequent evacuations, people living in temporary housing were desperate to know when they could go back home. The enterprise system for roadway asset management in Larimer County, one of the many counties in the state affected by the flooding, was not agile enough to quickly support a road closure web application. Instead, county GIS staff built a single-purpose linear reference system with dynamic event tables that were refreshed every time someone updated the locations of the road closure barricades.
To distribute this information about road closures throughout the county, staff created a public-facing website in under 5 hours, using a Google map front-end, dynamic segmentation techniques, ArcMap, Python, and ArcGIS Online. The website served an immediate need at the time, and has been so reliable that it became a model for the future, more robust version of the road closure website.
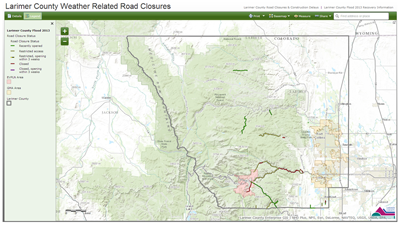 Figure 5: Screenshot from Larimer County's weather-related road closures application.
Large enterprise systems have their place in transportation and will always be needed. However, technology changes very rapidly and it is easy to become over-invested in one particular application or skillset. As you survey your own GIS toolbox of tips and tricks, look at more than the long-term needs of the enterprise and the desire to build the “killer app.” Consider building the occasional small and disposable solution, including those that have a very short but useful lifespan.
For more information, please contact:
Will Allender
Email: Will.Allender@newcenturysoftware.com
Phone: 970-267-2000
Drew Davis
Email: DDavis@larimer.org
Phone: 970-498-5742
Other News
Geospatial Data Sharing Reports
FHWA recently published three reports that explore how State Departments of Transportation (DOTs) and other transportation agencies are developing and using geospatial tools to support increased collaboration and improved information-sharing.
These objectives are associated with the Federal Highway Administration's (FHWA) Geospatial Data Collaboration (GDC) initiative (www.gis.fhwa.dot.gov/gdc.aspx), which encourages State DOTs and others to use geospatial tools to streamline and improve transportation decision-making.
These reports are now available at www.gis.fhwa.dot.gov/reports.aspx.
For more information about this newsletter, please contact Mark Sarmiento, FHWA Office of Planning, at Mark.Sarmiento@dot.gov.


