A Newsletter from the Federal Highway Administration (FHWA)
Printer-friendly PDF →
Fall 2020
Creating the Michigan DOT COVID-19 Hub
Article featuring Joseph Thick, WebGIS Administrator, and Cory Johnson, Manager of the Geospatial Management Section, of the Michigan Department of Transportation
The ongoing coronavirus (COVID-19) pandemic has impacted everything from the economy to social life to travel patterns. Public servants and citizens alike face a deluge of information from many different sources about how the pandemic affects their duties and their lives.
Joseph Thick of the Michigan Department of Transportation (MDOT) heard from coworkers that they were looking for maps of COVID-19 and transportation impacts in their areas. Joe is a WebGIS Administrator and Cory Johnson is the Manager of the Geospatial Management Section within the Data Inventory and Integration Division of the Bureau of Transportation Planning. The Geospatial Management Section is responsible for all geospatial data for MDOT, including supporting field data collection and deploying all Esri technology.
Joe and Cory sensed an opportunity to provide a one-stop shop for public health and transportation impacts data using an online, geospatial dashboard. The GIS Unit has substantial experience with web-based dashboards, having built over 170 dashboards with ArcGIS Online for use cases ranging from monitoring bridge conditions to project management, which prepared the team for success in rapid deployment of their dashboard. Despite the State’s shelter-in-place guidance, which required the GIS team to work remotely, the team was able to build the Michigan DOT COVID-19 Hub in just one day. Launched on March 25, the hub provides a one-stop shop for the public health and transportation impacts of COVID-19 for residents, commuters, MDOT staff, and other State agencies.
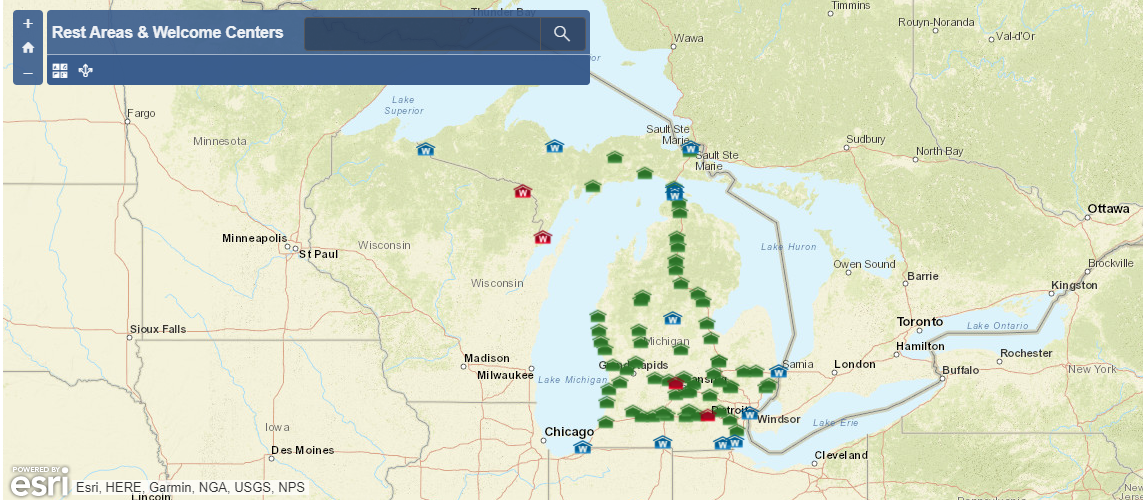
Figure 1. This interactive map on MDOT’s COVID-19 Hub displays the operational status of MDOT’s rest areas and welcome centers.
The team identified several existing data sources to incorporate in the dashboard. MDOT’s Traffic Monitoring Unit produced spreadsheets tracking the decline in traffic volume. A Power BI visualization is embedded in the hub, showing the change in traffic volume by region in the form of bar graphs, line graphs, and tables. The graphs compare monthly and daily traffic between 2019 and 2020 to demonstrate the change in traffic from baseline levels. The visualization is connected to MDOT’s live traffic count system for daily updates.
The hub also includes data on DOT facility closures, including rest areas, welcome centers, and international border crossings on an interactive map. A map displaying the locations of traffic cameras allows users to access live video feeds of traffic. The team embedded the Michigan COVID-19 Dashboard, operated by the Michigan State Police Emergency Management and Homeland Security (EMHS) Division, to provide the public health context for the transportation impacts displayed on the dashboard. The Michigan COVID-19 Dashboard displays near-real-time data on COVID-19 cases and fatalities for each of Michigan’s 83 counties, broken down by date, age, and gender. Finally, the hub displays the latest COVID-19 news by displaying tweets from several official sources, including the governor’s office, MDOT, the Michigan Department of Health and Human Resources (HHS), and the Michigan State Police EMHS Division.
Joe and Cory consider the COVID-19 Hub a major success. MDOT’s technical and operational capabilities allowed them to meet the real-time needs of the public. The team has heard from MDOT leadership that the dashboard has helped them to understand the potential effects of new traffic patterns on gas tax revenue. Everyday citizens have also used the dashboard to better understand the link between public health and Michigan’s transportation system. As of early August, the hub had over 27,000 pageviews and has been one of the most popular ArcGIS Online items since March.
Through this process, the team honed their ability to create rapid response dashboards for emergency situations. The team rapidly deployed another emergency response dashboard after the failure of the Edenville and Sanford dams near Midland, MI, coordinating with several State agencies to assist first responders and policymakers. For other transportation agencies and GIS specialists, Cory and Joe recommend identifying a point person to lead rapid response dashboard projects in advance. Knowing who is responsible for initiating a rapid response dashboard will make for more effective collaboration and a smoother deployment.
COVID-19 Vaccine Delivery: A Geospatial Approach
Editorial by Amy Nelson, Deputy Geospatial Information Officer, U.S. Department of Transportation
Amy Nelson manages USDOT’s geospatial response during disasters, leads USDOT’s implementation of Federal geospatial regulations and guidance including the Geospatial Data Act, and is the lead author of USDOT’s GIS Strategic Plan.
When an approved vaccine is available, how can it be delivered efficiently to the greatest number of people? The U.S. Department of Transportation (USDOT) manages and disseminates geospatial datasets that can assist in planning this critical effort.
Once the supply chain has been established and priority populations have been identified, transportation modal capacity will determine the number of vaccine doses that can be moved. Geospatial software is ideal for performing network analysis that can determine the fastest route for deliveries. USDOT provides geospatial data through our National Transportation Atlas Database (NTAD). The following layers can assist in calculating capacity and the most effective network routes:
- The Highway Performance Monitoring System (HPMS), which includes attributes related to capacity, overlaid on the All Road Network of Linear Referenced Data (ARNOLD) to facilitate network modeling;
- Airports;
- Ports;
- Intermodal Freight Facilities, which can be critical for determining transfers along the supply chain; and
- North American Rail Lines, which includes freight and passenger lines.
Road closure data is available from some States and should be included in the model. Geospatial software can calculate an alternate route when necessary. Population data and information on critical facilities, such as hospitals, can be obtained from the U.S. Census and Department of Homeland Security’s Homeland Infrastructure Foundation-Level Data (HIFLD) portal. Geospatial software also has the capability to power a dashboard (similar to COVID-19 case dashboards you may have seen) showing the number of doses delivered and the number on the way. Becoming familiar with the transportation GIS data layers can assist your agencies in quickly ramping up once a vaccine is approved.
Other News
Newly Available
Case Study on Asset Management Field Data Collection Tools
This case study report explores how select State Departments of Transportation (DOTs) use innovative, geospatial data collection tools in support of asset management plans. This case study features interviews with four agencies (District, Indiana, Vermont, and Wisconsin DOTs) to understand how States choose tools and methods to collect asset inventories, as well as to obtain feedback on what the Federal Highway Administration can do to facilitate the development of these processes. The report is available at
https://www.gis.fhwa.dot.gov/Reports.aspx.
Past Events
Data Dashboards Webinar
In this webinar, representatives from Arkansas DOT discuss how they created, update, and maintain the Arkansas Crash Analytics Tool (ACAT). ACAT organizes crash analytics data, including crash records and other reports, for the purpose of identifying, evaluating, and planning the safety enhancement of potential crash sites, hazardous roadway conditions, and railway-highway crossings. This webinar delves into how Arkansas DOT and its stakeholders use ACAT not only as a data tool to support decision-making, but also as a method of engagement with other State and local agencies and the public. A recording of the webinar is now available on the GIS in Transportation homepage, and a summary will be available at
https://www.gis.fhwa.dot.gov/Webinars.aspx.
Peer Exchange on Data Dashboards
The FHWA GIS in Transportation Program hosted a virtual peer exchange this month on the topics of GIS and data dashboards. Representatives of several State Departments of Transportation shared how they are using GIS and data dashboards to share information with stakeholders and the general public, and to advance the work of their agency. The participants also discussed the challenges and successes they have experienced and learned from each other. A peer exchange report summarizing the event will be available at
https://www.gis.fhwa.dot.gov/Reports.aspx.
Webinar on Using GIS for Data Dashboards: Oregon Transportation Safety Data Explorer
In this webinar, representatives from Oregon DOT discussed how they developed the Oregon Transportation Safety Data Explorer (OTSDE), an interactive web based GIS tool. OTSDE is designed for all skill levels, and is accessible to both internal and external users. This webinar explores how Oregon DOT uses OTSDE to identify corridors, filter and extract crash data, and inform multi-modal active transportation projects. Speakers also provided information on how OTSDE users can view and filter crash data, screen network data, and access transportation data for crash data analysis, traffic safety investigations, multi-modal analysis, and TSP (Transportation System Plan) reviews. A recording of the webinar is now available on the GIS in Transportation homepage, and a summary will be available at
https://www.gis.fhwa.dot.gov/Webinars.aspx.
Coming Soon
Case Study on Data Dashboards
The GIS in Transportation team interviewed five State Departments of Transportation (DOTs) on their use of geospatial data dashboards. The case study report investigates data dashboards for monitoring operations, measuring progress toward strategic goals, and presenting data to the public and other external stakeholders. It also presents best practices and lessons learned for other agencies interested in dashboard projects. The report will be available at
https://www.gis.fhwa.dot.gov/Reports.aspx.
Webinar on Leveraging GIS in ROW: Vermont Statewide Property Parcel Map
The State of Vermont, through a project originated at the Agency of Transportation, worked over a three-year period to develop a statewide property parcel data layer. The Statewide Property Parcel Mapping Project was a collaborative effort between a series of State agencies and departments, municipalities, and contractors to build a standardized statewide parcel data layer. This webinar will discuss the project from the initial enabling legislation, collaboration with Agencies and Departments, developing parcel standards, parcel data creation through vendors, issues experienced during the project, the Grand List, how this information is being used at the Vermont Agency of Transportation (VTrans), and transfer of the project to a program at the Vermont Center for Geographic Information (VCGI). This webinar will take place on Wednesday, February 17, 2021, 1:00-2:00 PM EST. Please register through Eventbrite.
2021 GIS-T Virtual Symposium
Originally planned to take place in Minneapolis, Minnesota, the American Association of State Highway and Transportation Officials (AASHTO) GIS for Transportation Symposium will now be held virtually the week of April 19, 2021. Updated information, including program and registration details, will be shared on the GIS-T website:
https://gis-t.transportation.org.
For more information about this newsletter, please contact Mark Sarmiento, FHWA Office of Planning, at Mark.Sarmiento@dot.gov.


