A Newsletter from the Federal Highway Administration (FHWA)
www.gis.fhwa.dot.gov
FALL 2012
Look at the National Park Service's (NPS) Park Transportation Investment Needs Analysis (PaTINA)
Upcoming Events
- Transportation Research Board (TRB) Annual Meeting
Jan. 13-17, 2013
- North Carolina GIS Conference: “The Power of Place”
Feb. 7-8, 2013
- Esri Federal GIS Conference
Feb. 25-27, 2013
- American Society for Photogrammetry and Remote Sensing (ASPRS) Annual Conference
March 24-28, 2013
- AASHTO GIS for Transportation Symposium: “Revealing a Gem”
May 5-8, 2013
This edition's Q&A is with Nell Conti, GIS Program Lead/GIS Specialist of the NPS Denver Service Center Planning Division. She discusses the NPS's PaTINA, a spatial analysis approach for national park long-range transportation planning.
What transportation needs exist at your agency, and how does PaTINA address these needs?
NPS is currently undergoing a national initiative to complete long-range transportation plans (LRTP) at the unit, regional, and national levels. NPS also has considerable transportation system maintenance needs and is looking for innovative ways to prioritize funding for park transportation assets as part of its LRTPs. In addition to considering more traditional asset priority rankings based on pavement condition, use, and cultural significance, the NPS LRTP process requires NPS to consider all mission-critical components. The process therefore requires identifying how transportation systems interact with other variables: natural resources, environmental hazards, climate change, adjacent cultural resources, and the visitor experience.
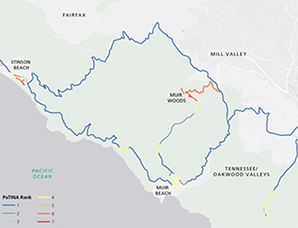 Example from a simplified composite hotspot map.
To look holistically at these impacts, the NPS Washington Support Office developed a geospatial analysis method called PaTINA. The PaTINA method uses spatial overlay analysis to examine a park's transportation network in relation to resource and visitor experience issues to identify transportation “hotspots.”
PaTINA then prioritizes transportation assets in relation to each variable. The results are used in conjunction with scenario analyses to prioritize transportation project needs to include in each LRTP.
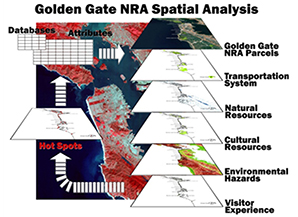 Spatial analysis process for Golden Gate National Recreation Area LRTP; Credit: Merlyn Paulsen, Colorado State University.
Can you provide an example of how PaTINA is being used?
A pilot project for PaTINA is nearing completion for Golden Gate National Recreation Area in the San Francisco Bay, California, area. As part of this project, PaTINA project staff worked closely with park staff and area authorities to gather relevant geospatial data. For example, Golden Gate National Recreation Area staff on the project's data team working group met with the Metropolitan Transit Commission in the bay area to gather data on transit. Staff then ranked the data based on impact to the transportation network and organized the information in a spatial database. For example, low-visitation areas received a lower ranking than high-visitation areas, since low-visitation areas typically have less impact on the transportation system than higher-visitation areas. Transportation hotspot maps were then developed for each PaTINA theme:
- Natural resource issues
- Cultural resource issues
- Environmental hazards (including sea level rise and other climate factors)
- Visitor experience
- Facility management (including transportation operations)
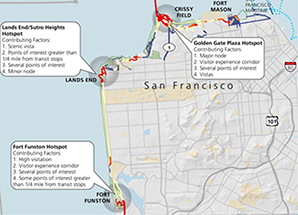 Example from Golden Gate National Recreation Area visitor experience hotspot map.
Transportation hotspots were defined as areas where multiple factors affected a section of the transportation network. For example, issues associated with a natural resource transportation hotspot could include proximity to critical habitat, wetlands, and sensitive vegetation. Using traditional spatial overlay analysis methodology, the thematic hotspot maps were combined to create a composite transportation hotspot map.
The composite map is a result of the overlay analysis and therefore every polygon has a value associated with it. These values can then be interpreted to represent a ranking. Low values would indicate a low ranking; high values (where multiple data layers converged) would indicate a high ranking. For example, a road in poor condition that is not important for visitor experience and is adjacent to sensitive resources may receive a low PaTINA ranking and therefore may be a low priority for funding. Overall, the thematic and composite maps allow the LRTP project team to holistically evaluate transportation assets.
The project team used web mapping technology to assist with data quality assurance and quality control throughout the PaTINA process. The project team was easily able to deploy web mapping applications using ESRI's ArcGIS Server and Latitude Geographics Geocortex Essentials. This allowed park staff and other stakeholders to interactively review geospatial information.
How will PaTINA help NPS?
If the PaTINA process is effective, it will help NPS more strategically apply funding to transportation assets and therefore save money over the long term. Future funding for PaTINA will depend on the success of the pilot project and on the overall budget climate for NPS. The PaTINA and LRTP project teams fully support PaTINA as an efficient and cost-effective approach to prioritizing transportation projects in a way that supports the NPS mission. PaTINA will enable the NPS to apply already scarce funding to priority places to improve the transportation experience within America's treasured national parks.
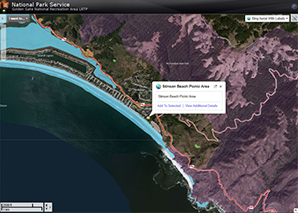 Screenshot of web mapping application showing wetlands and critical habitat near Stinson Beach within Golden Gate National Recreation Area.
Are there future plans to apply PaTINA at other parks?
In the near future, PaTINA may be employed at additional parks as a component of the NPS LRTP process. However, each park would use different themes and GIS data layers, as issues and challenges differ by park. NPS staff will eventually compile PaTINA's results at the regional and national levels to aggregate and report on key variables related to the NPS transportation network. The NPS LRTPs are reviewed every five years.
Ultimately, PaTINA results will be reevaluated on this timeframe to include updated GIS information and reflect staffs' understanding of the key issues at the park.
Data maintenance for PaTINA is exceedingly important for the long-term success of the methodology, and this feeds into other enterprise data efforts that the NPS is currently conducting.
What are some limitations of PaTINA and how is NPS working to overcome these?
Gathering and maintaining relevant geospatial data is a challenge for any comprehensive GIS application or project. PaTINA meets this challenge by collecting readily available data and documenting data gaps that are priorities to address by the next LRTP review cycle. As with any spatial modeling project, it is impossible to completely represent all variables in a qualitative, spatial manner. Because of this, it is important that PaTINA is viewed as a tool to facilitate greater understanding of key issues rather than as a comprehensive representation of the real world.
NPS has invested in using PaTINA to better understand our transportation system. When used appropriately, the tool has incredible power to communicate the impacts of a holistic set of variables on a park's transportation system and better inform decision-making at the park level and beyond.
For more information, please contact:
Nell Conti
Email: Nell_Conti@nps.gov
Phone: 303-969-2550
The Addition of GIS Improves Traffic Modeling:
Editorial from Eric Leaming, Oregon Department of Transportation (ODOT)
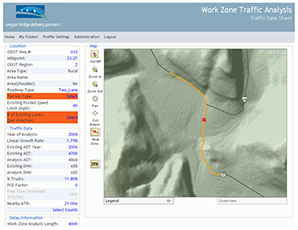 The GIS component of WZTA shows analysts where the work zone is and all the needed traffic data for that location, replacing the need to manually gather tabular data from multiple sources.
Work Zone Modeling
Taking time during project development to forecast traffic impacts pays significant dividends in safety, time, and money during construction for the public, the agency, and the contractor. A critical question that must be answered during project development is: how many lanes of traffic need to be kept open to safely accommodate road users through the work zone while allowing efficient roadwork to take place?
For many years, ODOT's Work Zone Traffic Analysis (WZTA) tool was an Excel spreadsheet that standardized an analysis approach that allowed engineers to answer this question. Using the spreadsheet, engineers could calculate delay estimates and determine optimal times for highway lane closures. The system was used for projects in construction, utility work, surveying, routine maintenance operations, and was a standard tool in project delivery.
Co-Innovation & Overcoming Bottlenecks
The WZTA tool had a number of limitations. The tool was becoming less effective for handling progressively larger workloads. More importantly, the tool did not display all of the information that traffic engineers needed. Analysts needed to manually collect tabular data such as traffic volume, highway grade, and road classification data to enter into the WZTA tool. They then had to calculate lane closure times based on these manually collected data.
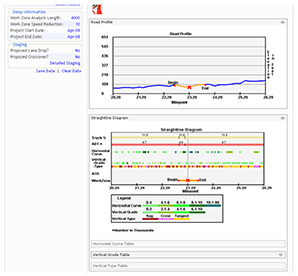 Vertical profiles and straight line maps graphically show analysts helpful location information needed to determine work zone impacts.
In 2007, ODOT mobility engineers, computer programmers, and GIS staff working on the Oregon Transportation Investment Act III bridge program critically analyzed the work zone traffic analysis needs of ODOT engineers. The team then created a custom web-based and GIS-enabled version of the tool.
GIS's Added Functionality
The addition of GIS and web-based capabilities makes the new WZTA tool more user-friendly and intuitive. Dynamic maps allow users to orient themselves to the transportation network and analyze traffic anywhere on the State highway system. Behind the scenes geoprocessing tools create non-map geodata visualizations, producing on-the-fly vertical profiles and straight line maps, as designed by highway engineers.
WZTA is now also web-based, making highway and traffic data available to the public. The application is now accessible to anyone who wants quick access to detailed highway and traffic data. Additionally, the web-based features allow consultants and qualified users to run dozens of traffic staging simulations in the time it used to take to run one.
These simulations allow ODOT to optimize and balance staging, traffic mobility, contractor efficiency, and stakeholder partnerships, thereby minimizing road user delay, maximizing safety for workers and road users, and minimizing the risk of costly contract change orders during construction. ODOT took the latest in GIS technology and combined it with a web interface to consolidate and analyze traffic data more efficiently. The success of this tool highlights the ability of GIS to support the visualization of existing traffic data from varied sources and provide multi-level analysis that is easily understandable to end users. For more information, please contact:
Eric Leaming
Email: eric.s.leaming@odot.state.or.us
Phone: 503-986-3493
WZTA website:
https://www.oregon.gov/ODOT/Engineering/Pages/Work-Zone.aspx
Other News
Reports
FHWA produces reports on the use of GIS tools and applications to support transportation decision-making. Most recently, FHWA released a report called “Case Studies in Geographic Information Systems for Environmental Streamlining.” The report provides background on the use of GIS to streamline the environmental review process, describes the efforts of five public agencies that have developed tools or processes to do so, and identifies key conclusions. Please visit www.gis.fhwa.dot.gov/reports.aspx to view this report.
State and Local GIS Practices Database
FHWA recently completed a comprehensive update of its database of State and local GIS transportation applications that are currently being employed across the nation. Approximately 60 new applications were added and 100 existing applications updated. In addition, applications described in past newsletters have been added to the database. Information about each application can be found at https://www.gis.fhwa.dot.gov/gis_practices.aspx. Please visit the site to learn more or to submit information about your agency's transportation GIS applications.
Webinars
FHWA sponsors a quarterly GIS webcast series that provides information about current GIS efforts, applications, and initiatives. Planners from State Departments of Transportation (DOTs), Metropolitan Planning Organizations (MPOs), and others are particularly encouraged to attend. To view previous webinars, please see www.gis.fhwa.dot.gov/webinars.aspx.


