A Newsletter from the Federal Highway Administration (FHWA)
www.gis.fhwa.dot.gov
FALL 2011
A Look at the Transportation Secure Data Center (TSDC) to Provide Real-World Data for GIS Analysis and Modeling
Upcoming Events
- Transportation Research Board Annual Conference
Washington, DC
January 22-26, 2012
- Esri Federal GIS Conference
Washington, DC
February 22-24, 2012
This edition's Q&A is with Jeff Gonder (Senior Engineer) and Evan Burton (GIS Analyst), both of the National Renewable Energy Laboratory (NREL) Center for Transportation Technologies and Systems (CTTS). They discuss developing and deploying the TSDC to securely archive and access detailed transportation data.
Why the TSDC?
Having access to existing travel data is critical when there is insufficient time or resources to support detailed data collection. High-resolution travel data collected with global positioning system (GPS) technology provides tremendous research value, but privacy concerns often prevent disseminating these data to secondary users (since the precision with which GPS identifies travel locations could be misused to determine the identity of a survey participant).
To address the dilemma of providing access to valuable data while protecting privacy, NREL partnered with the U.S. Department of Transportation (DOT) to launch the TSDC. Additional information is available at www.nrel.gov/transportation/secure-transportation-data/.
Who are the intended users?
Metropolitan planning organizations (MPOs), universities, national laboratories, air quality management districts, disaster planning agencies, and auto manufacturers can use the TSDC to find information valuable to their efforts. TSDC data can be used in GIS and as part of analyses for:
 3D rendering of a TSDC accessibility analysis
- Transit planning;
- Travel demand modeling;
- Congestion mitigation;
- Emissions modeling;
- Vehicle energy analysis;
- Climate change impact studies;
- Evacuation planning;
- Alternative fuel station planning; and
- Validating transportation data from other sources.
How is the data center structured?
The TSDC consists of three different areas:
- A publicly accessible website from which users can download “clean” versions of datasets (e.g., high-level summary data and detailed speed profiles without spatial information for performing vehicle power and energy analyses).
- A controlled-access environment in which approved users can run analyses but not download raw data. Before obtaining an account for the controlled-access remote environment, prospective users must complete an application process to justify their access need and must sign a usage agreement.
- A location with no external access that securely stores and backs up raw data from each provider. NREL performs data processing in this area for quality assurance and to generate externally accessible data.
 A navigable manual provides general information and guidance for users.
What is the source for TSDC data sets?
Various organizations and planning agencies provide datasets to include in the TSDC. Each provider uses different database formats and processing methods, which creates a challenge for presenting the data in a consistent manner to TSDC users.
To achieve maximum consistency, NREL developed a standard processing method to compile all data into a uniform database format. At its core, the relational database references three attributes common to each dataset: latitude, longitude, and timestamp. Higher-level data (distance, speed, etc.) can be derived from these three attributes.
Database relationships are also established between GPS points and unique identifiers for each trip, vehicle, and household, and in turn for demographic characteristics of each household and vehicle. After interpreting the relational database, information is converted into both PostGIS and ESRI geo-database formats.
 Sample of demographic, processed trip, and regional data available in the TSDC
What are some examples of TSDC datasets?
Some of the TSDC's datasets were collected as add-on samples to traditional diary-based regional travel surveys to assess issues such as trip underreporting. These GPS samples typically include second-by-second data for several hundred vehicles recorded over one or more days—up to a week or two at most. For example, the Texas DOT provided travel datasets for Houston, San Antonio, and Austin (variously collected between 2005-2009).
The Southern California Association of Governments (SCAG) provided a similar travel dataset for a study conducted in the Los Angeles area from 2001-2002. SCAG analyzed raw GPS points to approximate participant home, work and trip start/end locations by using the center of the U.S. Census tract in which these points fell (the Census Transportation Planning Package uses a similar approach to aggregate data). SCAG then provided a dataset to the TSDC that includes tract-level summaries and corresponding shapefiles, as well as full GPS travel profiles.
The Puget Sound Regional Council (PSRC) in Washington provided another large dataset from a FHWA-sponsored research project on pricing. The study collected data from 2004-2006 to evaluate travel behavior changes in response to time- and location-variable road tolling. The particular value of this dataset is that it contains GPS data from over 400 vehicles over a period of 18 months. Of this time period, seven months were devoted to a hypothetical road tolling experiment.
What GIS techniques have been used for data processing and quality control?
It is important to ensure the accuracy of the GPS points included in various datasets. Errors in the initial data could propagate to the higher-level distance and speed calculations. For instance, an erroneous or missing GPS point could create excessive distance and speed calculations. A researcher using these data in a vehicle simulation might subsequently overestimate the levels of power and energy required.
 uDIG and ArcGIS desktop applications
One method used to address such errors is to run raw data through a processing routine to remove or adjust points that produce outlying speeds or infeasible accelerations and to fill in time gaps from cold-start or mid-cycle signal drop-outs.
Additional accuracy can be obtained by using GIS techniques to restrict point readings onto a path of travel defined by the road network. This prevents calculation errors such as “corner cutting,” where the actual distance between successive point readings is greater than the calculated linear distance due to a curve or turn in the road. The coarse point recording interval in the PSRC dataset (roughly every ten seconds rather than every one second) made it particularly important to implement such a map matching routine.
What tools are available in the TSDC controlled-access area?
After completing the application process and receiving approval, TSDC users can access detailed spatial data through a secure, remote desktop environment.
 Road reduction filtering and road grade adjustment for an
advanced map matching processing routine
The remote desktop includes both licensed and free and open source (FOSS) tools for database query, programming, and analysis. FOSS tools include PostgreSQL/PostGIS, uDig, GRASS, Python(x,y), and R. The ESRI ArcInfo software suite provides a user-friendly integrated system for working with data. FOSS tools require more programming expertise, but can provide faster computational efficiency. (Important when working with datasets such as the one provided by PSRC that contains over 28 million GPS data points).
How is the data center funded?
FHWA's Offices of Planning and Operations provided start-up funding for the TSDC. Internal NREL funding has also been used to support TSDC equipment and software purchases.
What are some anticipated future plans for the TDSC?
NREL has investigated a process to integrate consistent road grade information into each dataset by using digital elevation models. NREL will add this feature after completing further accuracy testing. Other future plans include expanding the number of datasets hosted in the TSDC, incorporating commercial vehicle data, and continuing efforts to further improve and refine TSDC data standardization and quality control processes.
NREL will also make other feature additions in response to requests from a growing user base. One such addition may be creating a user-friendly interface for FOSS tools to leverage their speed and cost benefits for users to perform common analyses.
For more information, please contact:
Jeff Gonder – Jeff.Gonder@nrel.gov
Evan Burton – Evan.Burton@nrel.gov
Using GIS to Identify Location Efficient Neighborhoods
Editorial from Albert Benedict, Center for Neighborhood Technology
Location Efficiency
Just as a building can be energy efficient and a car can be fuel efficient, the Center for Neighborhood Technology (CNT) and others have demonstrated that a neighborhood can be location efficient as well. Compact neighborhoods with walkable streets, access to transit, proximity to jobs, and a wide variety of stores and services have high location efficiency. These types of neighborhoods require less time and money, and result in fewer greenhouse gas emissions, as residents meet their everyday travel requirements.
Conversely, areas far from job centers and with low density and little access to goods, services, or transit leave residents largely dependent on automobiles to meet their daily needs.
GIS Used to Quantify Location Efficiency
CNT, a Chicago-based nonprofit that fosters urban sustainability, quantitatively demonstrated the concept of location efficiency by constructing a model to estimate auto ownership, auto use, and transit use to calculate household transportation costs.
Using GIS analysis, CNT was able to consider the spatial relationship of urban form variables such as housing density, access to transit, job proximity, and walkability, as well as their relationship to transportation costs. This transportation model, combined with housing costs, is the analysis behind the Housing + Transportation (H+T®) Affordability Index, which quantifies combined housing and transportation costs at the Census Block Group level for the metropolitan and micropolitan areas in the United States.
Modeling Transit Connectivity and Employment Access
There are two inherently spatial variables in the Index that could not have been calculated without GIS: the Transit Connectivity Index (TCI) and the Employment Access Index.
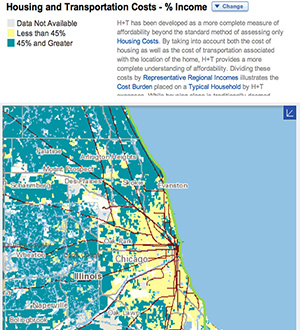 Screenshot of H+T Affordability Index
The TCI measures the availability and frequency of transit at the census block group level by considering the concentration of buses within a ¼ mile of stops and the concentration of rail within a ½ mile of stations. CNT developed an online GIS tool to record transit stop locations and level of service by time and day. Using this tool, CNT is constructing the TCI for a core group of U.S. transit agencies.
CNT's Employment Access Index is a weighted measure that estimates both the quantity of and residents' access to jobs in a region. It is calculated using an inverse-square law. It models total access to jobs in a metropolitan area using the sum of the number of jobs divided by the square of the distance to those jobs.
Conclusion
GIS tools made it possible for CNT to quantify household transportation costs as a function of a neighborhood's location efficiency. The H+T Index has helped expand the definition of affordability to include transportation costs, the second largest expense in a household budget.
The concept of location efficiency helps people make better choices about where to live. Some neighborhoods with relatively high housing costs may in fact be affordable after factoring in a lower cost of transportation. Similarly, places that have relatively low housing costs may in fact be unaffordable because the cost of getting around is quite high.
The concept of location efficiency can also help inform and guide the planning process, from seemingly disparate projects of increasing a highway's capacity to developing a mixed use building. The H+T Index is a tool that quantifies the benefits of location efficiency that planners can use to create communities that are affordable, equitable, and environmentally sustainable.
To see how your neighborhood transportation costs compares to others, visit htaindex.cnt.org.
Other News
Website Update
FHWA has updated the GIS in Transportation website at www.gis.fhwa.dot.gov. The website offers information on GIS events, industry news, and innovative GIS applications from around the country, as well as the FHWA GIS in Transportation quarterly webcasts and newsletters.
The website also includes ways to stay in touch and informed about events through an email listserv, Twitter ‘tweets,’ and an RSS feed.
To sign up for the listserv or access the Twitter and RSS feed options, please see the “Connect” section in the lower right-hand corner of the website.
Reports
FHWA produces reports on uses of GIS tools and applications to support transportation decision-making. Most recently, FHWA released Applications of GIS for Climate Change in August 2011. The report describes current practice and application of GIS technologies for integrating climate change into the transportation decision-making process. It examines how select state, regional, and local agencies are using GIS to analyze, mitigate, and adapt to the potential effects and impacts of climate change on the transportation sector
This report and others are available at www.gis.fhwa.dot.gov. Please visit the site to learn more or to submit information about your agency's transportation GIS applications.
Webcasts
FHWA is sponsoring a quarterly series of GIS webcasts that provide information about current GIS efforts, applications, and initiatives. The target audience is planners from State Departments of Transportation (DOTs), Metropolitan Planning Organizations (MPOs), and others.
If you are interested in presenting in a future webcast, please notify Alisa Fine at Alisa.Fine@dot.gov (617-494-2310).
For More Information
For more information about this newsletter, please contact Mark Sarmiento, FHWA Office of Planning, at Mark.Sarmiento@dot.gov.


