A Newsletter from the Federal Highway Administration (FHWA)
www.gis.fhwa.dot.gov
Fall 2009
A Look at WSDOT's Winter Operations Application
This month's Q&A is with Alan Smith and Tom Clay of the Washington State Department of Transportation (WSDOT). They discuss WSDOT's use of GIS and the Winter Operations system.
What transportation needs existed at your agency and how did use of geographic information systems (GIS) help address these needs?
A. WSDOT developed a GIS-based winter operations system to obtain better information about its response to winter storm events and better data on what WSDOT was doing, when, where, and how much. WSDOT knew roughly how much material was going in and out of the yards, but not where it was going. WSDOT knew that it was plowing roads, but it did not know when a given stretch of road was plowed.
GIS has provided WSDOT with the ability to better track and manage current maintenance activities. GIS also provides the ability to better analyze historic activities by providing historic map views of conditions and assets during a previous storm event. Finally, GIS provides the ability to measure and report on the effectiveness of WSDOT's response to winter storm events. GIS analysts can create maps and reports that illustrate factors like material usage by state route or maintenance region.
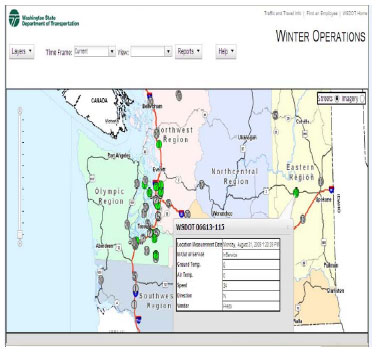 Screenshot of winter operations system showing a statewide view.
Why was GIS chosen as a tool to meet these needs?
A. Tabular queries and reports are very useful. In many cases, a tabular report is the best place to go to get information, but much of what a DOT does is closely related to a place on the earth. The essence of what WSDOT needed was a way to track, analyze, and report on point and linear "events." Events might include plow blade movement or a road temperature change. Those events are taking place at known locations on the earth at knowable times. GIS is the only technology (that we know of) that can effectively work with spatial events.
In real time, GIS can show where a truck is, the type of truck, what the truck is doing, and some information about the world around the truck. A map click on a traffic camera icon shows actual conditions. Also, orthophotography provides basemap context.
GIS can also be used to view and analyze historic and post-storm event data.
GIS can show us that a particular stretch of road was icy, when and how much of a particular deicing product was applied, and treatment results. GIS can overlay traffic incident data and correlate those events with road conditions. GIS can also overlay traffic flow data to illustrate improvements gained by a given treatment or activity. It also provides a map showing where WSDOT spends most of its time and disperses most of its material, helping the department to be more efficient in the future.
What is the Winter Operations AVL project?
A. The Winter Operations AVL project allows staff to use GIS to monitor current winter storm event activities and analyze recent historic activities. The analysis is done through a browser-based mapping application that was developed in Java Script and is driven by an ArcGIS server. The application consumes and displays several cartographic map services and geoprocessing services.
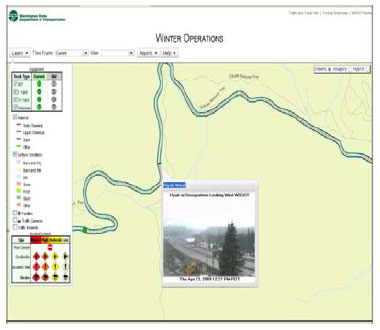 Screen shot of winter operations system.
Users can control the display of a transportation basemap, orthophotography, road condition line segments, road treatment line segments, current truck locations, and traffic cameras. The user can choose to view current or historic information. Truck locations are illustrated by a circle containing a symbol, which indicates the type/class of truck. The circle's color shows if trucks are currently operating.
Clicking on a truck triggers a pop-up widow that displays details regarding the truck (e.g., plow blade position, material dispersion, road temperature, air temperature, sky condition, speed).
Clicking on a color-coded road condition segment triggers a pop-up widow that displays details regarding that stretch of road (e.g., "bare and dry," "bare and wet," ice, slush, packed snow, snow).
Clicking on a color-coded road treatment segment triggers a pop-up widow that displays details regarding what has been done to that stretch of road (e.g., date/time, type/brand, and amount of material dispersed).
The application also provides a link to tabular reports that provide details of lane miles and total material usage by State Route Mile Post (SRMP), a linear route measure used to locate events and features along a state route.
Who initiated the application of the Winter Operations AVL system?
A. Tom Clay, the Maintenance and Operations Information Technology (IT) Manager, was aware of map-based services that various vendors provide. Tom approached Alan Smith, WSDOT's GIS Technology Specialist, and asked what WSDOT could do in-house.
The resulting project was a team effort depending heavily on about eight key individuals and many others who contributed as needed. The effort was supported by staff from Maintenance and Operations, Geographic Services, and IT. The effort also benefited from occasional support from two technical staff members of ESRI's Olympia, Washington, office. The effort, which took about eight months to complete, was implemented with a project manager and data modeler, as well as systems administrators, GIS application developers, and SQL application developers. Enhancements and modifications to the system continue.
What other factors contributed to use of this system?
A. WSDOT worked with two different vendors that Winter Operations provided rudimentary point-based mapping applications. These applications were not "aware" of roads; they simply placed truck location symbols on a basemap. WSDOT found it difficult and ineffective to manage resources with two different mapping applications and reporting systems. By bringing the data in-house, the department consolidated the information into a single system and can deliver more advanced line-based event placement on its own data. WSDOT is free to develop and enhance the system as it sees fit and to expand the technology into other WSDOT business areas.
Where does WSDOT obtain the data for the Winter Operations system?
A. Event data are transmitted from the trucks to vendor servers via cell modem. WSDOT receives the data from the vendors via web services and stores the information in a database. An ArcGIS server converts the GPS point event locations to SRMP and updates each event record with SRMP and linear referencing system (LRS) line segment information. This process allows the GIS to represent each event as a truck location and as an event on an LRS line segment. Other basemap layers are served out by the ArcGIS server as cartographic map services. Orthoimagery is obtained from ESRI's free online service and blended at the client. WSDOT has been using GIS for cartography for many years and has compiled a wealth of GIS data.
Are there challenges in securing funding for use of the system?
A. The Winter Operations AVL project was initiated as a proof of concept with minimal funding. Much of the work was done as time allowed without specific funding. Funding and support were just enough to keep it going. Even now with WSDOT's recent receipt of an international award for "Special Achievement in GIS," it is very difficult to obtain funding. To an extent, GIS continues to be viewed as something for making paper maps.
The long established values of GIS-analysis, dynamic graphic reporting, and system integration-are not widely understood. GIS is generally funded on a project-by-project basis, building disconnected islands of data and functionality, rather than a central enterprise resource.
How has the use of Winter Operations met WSDOT's transportation, business, and/or technical needs?
A. Within the context of the Winter Operations AVL project/System: managers and staff with accurate and timely data, in support of decision- making, to effectively manage the transportation system and answer questions related to the following items:
- Road conditions and events.
- Materials management.
- Workforce leveling.
- Time management.
- Vehicle hourly usage.
- Work scheduling.
- Crew safety.
- Improved managerial oversight of departmental field crews.
- Map truck/equipment level of service on routes, post-storm.
- Allowable surface conditions on routes during storms.
- Management of winter resources and events by the maintenance office.
Reports and user feedback verify these benefits. In a broader sense, WSDOT knows that GIS/geospatial technologies are succeeding because interest in GIS is growing at an alarming rate. Several business areas have acquired GIS staff. In addition, efforts to replace legacy systems are including requirements for some form of GIS.
Are there future plans to change how GIS technologies are used at WSDOT?
A. The Winter Operations AVL project example is now being followed within WSDOT in the form of a traffic flow and command center application. There is also some consideration of Winter Operations applying the same solution to track vegetation abatement work. The idea of event placement (i.e., "at this time, in this place, this thing happened") can be applied in many areas of business, such as mowing, paint stripes, emergency response, and others.
In general terms, some at WSDOT are working to respond to specific needs with general services. If someone asks for a custom application interface between ArcGIS Explorer and specific documents in a document management system, the department strives to meet that need with reusable services, rather than generating code that is exclusively useful to the specific request.
In even more general terms, there are considerations regarding where GIS should live, who/how it should be directed, and how it should be funded. With resources as scarce as they are these days, it is very important that WSDOT be careful with the resources that it has. Delivering GIS through islands of isolated data and applications is not cost effective.
What have been the critical success factors or lessons learned while applying GIS?
A. WSDOT's success with the AVL project was supported by a cooperative, multi-business area team, a supportive and heavily involved customer, a supportive and success-oriented GIS vendor, rapid cyclical application development process, and enlightened management that recognized the value of this technology.
Upcoming Events
- GIS Tools for Strategic Conservation Planning
October 27-30, 2009
Shepherdstown, WV
- 2009 GIS in Transit Conference
November 16-18, 2009
St. Petersburg, FL
Editorial from Dan Ross and Susan Bousquet, Mn/DOT Office of Information and Technology
Minnesota Department of Transportation (Mn/DOT) employees have a new web-based tool to search for spatial information and services. The GIS Portal allows users to search transportation-related data and metadata including roads, crashes, traffic, pavement, cadastral, geodetic control, and hydrographic data, web mapping services, imagery, static maps, and applications. Currently, the tool offers about 600 data layers to users.
The new tool, made available by the Enterprise GIS (EGIS) Services Unit in the Office of Information and Technology Services, provides users a focal point for identifying spatial information in Minnesota and the surrounding region.
The GIS Portal is a catalog and map viewer for spatial information. Users can utilize either a text-based or map-based search to query for information. The data may be local or statewide in nature. Metadata identifies the area of geographic coverage, data stewards, update frequency, and other important information for each set of data.
For example, GIS Portal users can search for "highways" and find information such as major roads, reference posts, average annual daily traffic, and final right-of-way maps. Users will find direct links for this information and have the ability to view and save map- and text-based queries. Users can also use the GIS Portal to search for available data from Mn/DOT and other agencies and states.
The new GIS Portal meets one of the EGIS Unit's strategic objectives to make data from multiple business areas, organizations, and agencies available in a single location.
The initial release of the GIS Portal includes some of the more frequently used spatial data. Additional information will be published as it becomes available. Any data steward within Mn/DOT can submit their spatial information for publishing.
The GIS Portal is currently an internal website. Mn/DOT is working on the next version, which will be available externally and will allow partners, customers, and citizens to search for and view data, connect to services, or download data. For questions or additional information about the Mn/DOT GIS Portal, contact Paul Weinberger at 651-366-4121 or Paul.Weinberger@state.mn.us.
Other News
Recent Reports
Over the last year, FHWA has released several reports related to applications of GIS for transportation decision-making purposes. These reports, listed below, are available along with others at FHWA's GIS in Transportation website: www.gis.fhwa.dot.gov. Visit the site to learn more about these reports and submit information about your agency's transportation GIS applications.
GIS Applications in Eco-Logical Grant Projects (October 2009) — This report provides a summary of a 1.5-day peer exchange held in Austin, TX in July 2009. The exchange convened select recipients of FHWA's first Eco-Logical grant and allowed recipients the opportunity to share information on the GIS activities implemented with grant support
GIS Applications for Bicycle and Pedestrian Planning (July 2009) — This report provides a summary of a 1.5-day follow-up peer exchange held in Miami, FL in May 2009. The peer exchange was sponsored by the FHWA's Office of Interstate and Border Planning.
For More Information
For more information about this newsletter, please contact Mark Sarmiento, FHWA Office of Interstate and Border Planning, mark.sarmiento@dot.gov.


