STIP/TIP GIS
Peer Exchange Summary Report
August 13-15, 2024
Online Peer Exchange

Participating Peer Agencies:
Federal Highway Administration
Massachusetts Department of Transportation
Michigan Department of Transportation
North Carolina Department of Transportation
Missouri Department of Transportation
Rhode Island Metropolitan Planning Organization
Oahu Metropolitan Planning Organization
Oregon Department of Transportation
Pennsylvania Department of Transportation
South Dakota Department of Transportation
Prepared for:
Office of Planning
Federal Highway Administration
U.S. Department of Transportation
Print-ready report PDF (2.5 MB)
Contents
Return to Top
Purpose
The Federal Highway Administration’s (FHWA) Geographic Information System (GIS) in Transportation program sponsored a three-day virtual peer exchange in August 2024 to bring together practitioners of GIS applications to discuss and learn about how State Departments of Transportation (DOTs) and Metropolitan Planning Organizations (MPOs) use geospatial applications to support their STIP/TIP planning processes. The peer exchange took place on Teams.
Participating peer agencies included the Massachusetts Department of Transportation, Michigan Department of Transportation, North Carolina Department of Transportation, Missouri Department of Transportation, Rhode Island Metropolitan Planning Organization, Oahu Metropolitan Planning Organization, Oregon Department of Transportation, Pennsylvania Department of Transportation, and South Dakota Department of Transportation. Also in attendance were representatives from FHWA Headquarters. On each day of the peer exchange, three peer agencies offered presentations. To help manage and highlight the overall effort, FHWA asked the United States DOT (USDOT) John A. Volpe National Transportation Systems Center (Volpe Center) to develop a report that provides a summary of the peer exchange, background and summaries of each presentation.
Return to Top
Background
FHWA initially recognized the need for a peer exchange on this topic based on interest from State DOTs through the GIS for Transportation (GIS-T) 2023 Survey administered by the American Association of State Highway and Transportation Officials (AASHTO). A case study discussion was undertaken in 2023 with the conclusion that a more detailed peer exchange would be beneficial to accompany an overall final report.
Return to Top
Peer Presentations: Day 1
Massachusetts Department of Transportation (MassDOT)
MassDOT has a capital investment plan that is updated every 5 years and that incorporates projects from the State’s 10 MPOs and 3 regions.
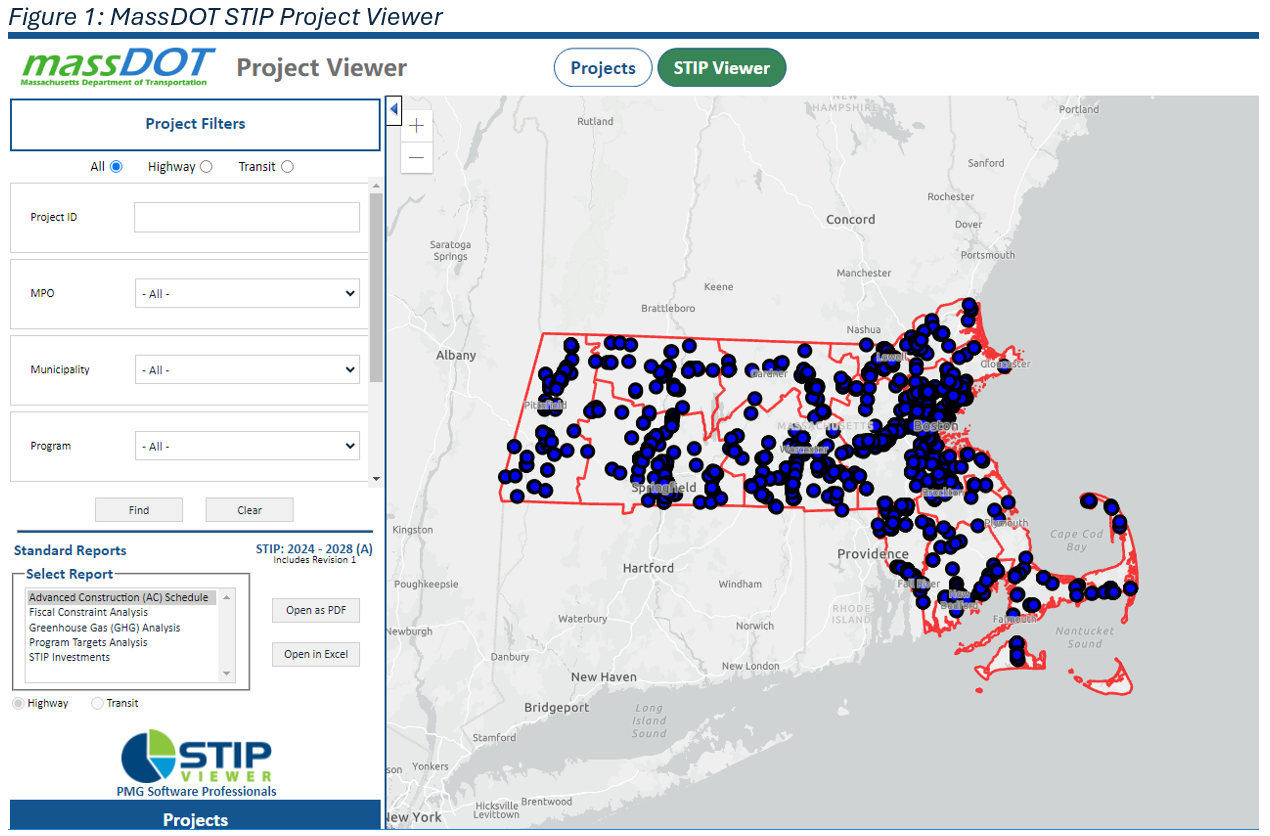
The State’s GIS platform is called GeoDOT, which allows users to view, create, and share GIS data in a collaborative environment. One application within GeoDOT is the State’s eSTIP. The State contracted PMG to develop the State’s eSTIP as a solution to the previous analog STIP. The analog STIP meant that there was no central, authoritative source of the STIP, leading to inconsistent reporting, long processing times, challenges demonstrating discal constraint in real time, and issues with timely project delivery. The updated Esri-based eSTIP went live for highway projects in 2020 and transit projects in 2022. It is used by both the State and its regional partners.
MassDOT’s eSTIP is integrated with and populates data from the State’s Project Information (PINFO) system. The eSTIP also features Financial Management Information System (FMIS) integration and offers budget management capabilities.
MassDOT’s eSTIP tool offers some key capabilities, including:
- A single authoritative, regularly updated source of information
- Staging and review for changes to avoid mistakes
- A record of historic STIPs
- Filtering by MPO, highway program, project ID, STIP years, and more
- The ability to score projects right in the tool
- Visualization of projects on a map, including via a public project viewer
- The creation of standard reports
The eSTIP tool has benefited MassDOT in a variety of ways, including greater interagency coordination, more consistent reporting, more efficient project readiness and delivery, and enhanced financial tracking. MassDOT also highlighted some potential challenges, including that making changes to the application when federal requirements change can be a burden and that assigning permissions to MPOs and regions can seem administratively burdensome. MassDOT intends to improve PINFO integration and incorporate regional project scoring applications into the eSTIP tool soon. MassDOT also expressed interest in incorporating a database in the eSTIP that displays all project ideas for consideration.
The GIS data that the eSTIP reads is fed by a layer held in the State’s Massachusetts Project Intake Tool (MaPIT). When projects are introduced, they are assigned a geography based on the State’s linear referencing system (LRS). As the project goes through its life cycle, this geography is slowly refined. If a project geography does not already exist in the LRS, it is ultimately added to the LRS. Geography changes in MaPIT are updated live in the eSTIP project layer.
Figure 1: MassDOT STIP Project Viewer
Source: https://gis.massdot.state.ma.us/dataviewers/projectviewer/?page=STIP-Viewer.
Return to Top
Michigan Department of Transportation (MDOT)
MDOT has a 4-year STIP that is updated annually. Although MDOT has used GIS it its program development for over a decade, the State recently recognized the need to streamline its GIS workflow. In 2021, MDOT began assembling requirements for a new GIS platform, which resulted in the interactive Michigan Transportation Program Portal (MTPP).
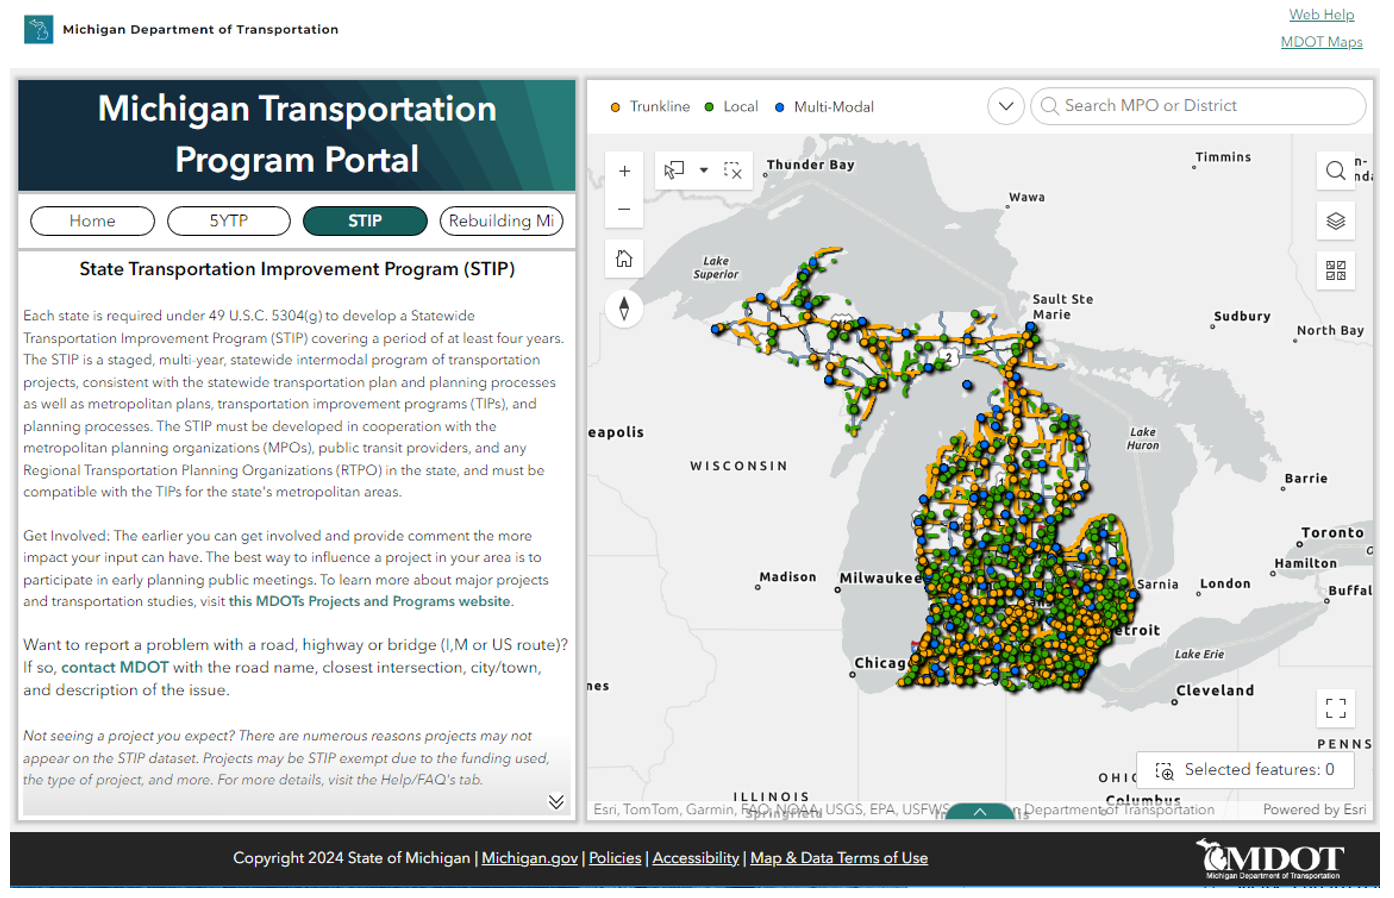
MTPP has improved the public input process. Previously, the burden was on the public to provide enough information to clarify the project about which their comments referred. With the new system, when the 30-day comment period is open, MDOT provides interactive maps for the 5-year program and STIP to facilitate public input through ArcGIS Survey123. When a project is clicked, a pop-up box offers information about the route, location, work description, type of work, structure, job ID number, fiscal year of obligation, construction year, EJ priority area, and contact information. The STIP map is similar to the 5-year program map but includes expected obligation dates rather than the actual obligation dates. Since rolling out MTPP, MDOT has experienced a significant level of interest as measured by comments received. On the backend, MDOT maintains a database that documents the number and source of comments in order to gauge public sentiment for each project.
MDOT uses JobNet to program jobs. In 2017, JobNet was integrated with GIS. Each project location has several attributes such as route, city, region, county, MPO, EJ, and nonattainment area boundary.
Because MDOT’s IT environment is heavily Oracle-based while the GIS Enterprise is SQL-based, many of the State’s efforts have focused on integrating these two systems. The State’s LRS, which it has maintained since 2021, is updated annually. This update involves a 6-month migration process during which projects must be moved to the new LRS.
The MTPP is built in ArcGIS Experience Builder. Recently, MDOT updated the layout and is now offering ADA accessible templates. MTPP makes searching for projects and communicating project information easy. Many legislators use this platform to communicate projects to their constituents. Users can also download or connect to the data through an API via the State’s Open Data Portal. MDOT is currently working to make MTPP mobile-friendly since a majority of visits to the site are from mobile devices.
Figure 2: Michigan Transportation Program Portal (MTPP) STIP Viewer
Source: https://experience.arcgis.com/experience/f3a4872ac4444f5eac3adf4c656d0a53/page/TransportationProjPortal/?views=State-Transportation-Improvement-Program.
Return to Top
North Carolina Department of Transportation (NCDOT)
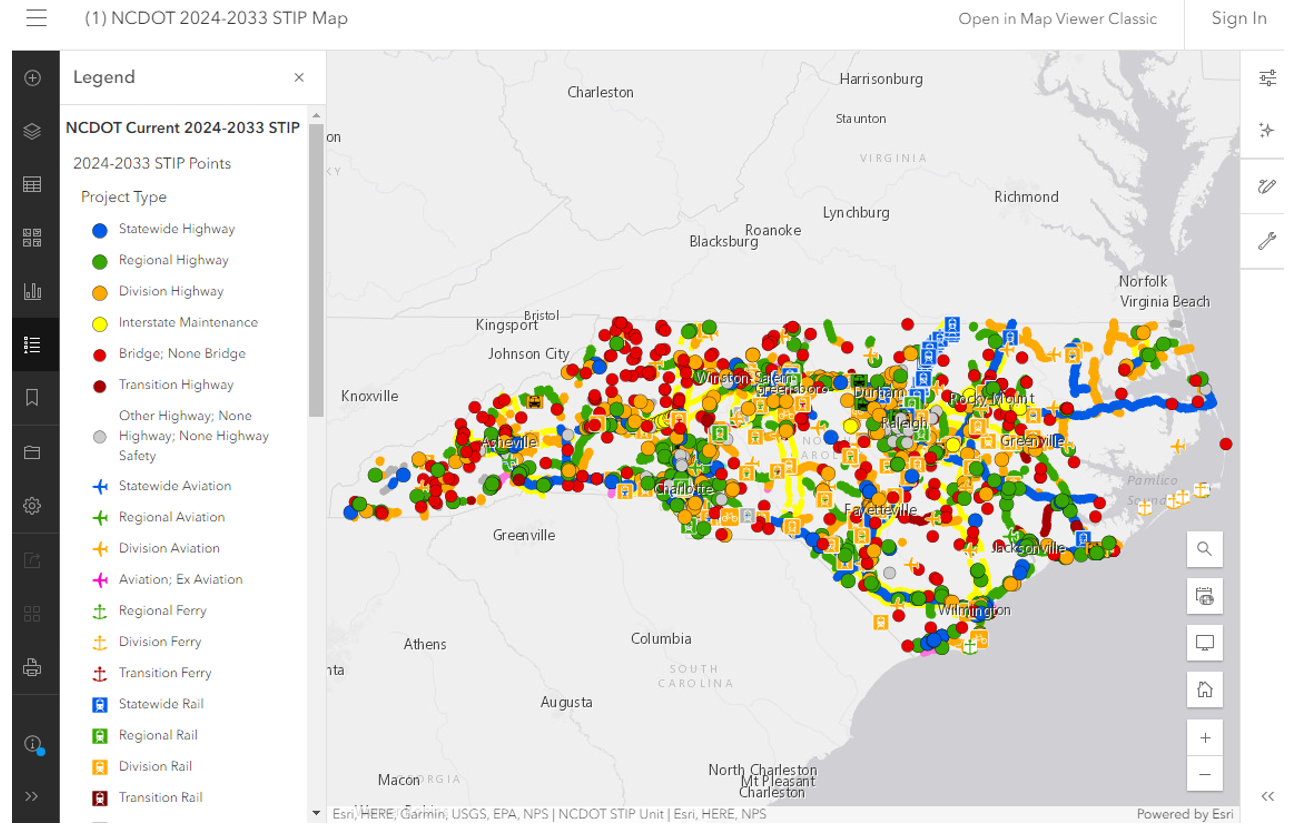
The first iteration of a GIS-enabled STIP was called SPOT Online and was released in 2013. It helped NCDOT intake new projects, use GIS overlays to generate project scores, and produce cost estimates. Over time, projects were referenced to the State’s LRS which made it possible to visualize the STIP in an ArcGIS-based map.
Currently, project information is managed in Microsoft Access database. Every month, this data is pulled to update the GIS online map using a number of scripts built in-house. Although this work is partly manual and is not live, it does enable the state to produce a web map. NCDOT also publishes an Excel which is a highly manual process.
SPOT Online was designed for one or two cycles, i.e. as an interim solution. Development began in 2016 on the State’s STIP Manager application. It is being developed by PMG and is expected to go live in Spring 2025. The STIP Manager development process has been very lengthy, largely because it is being custom built, and it has taken time to articulate and incorporate the unique requirements of each internal team.
The STIP Manager will have some useful new features. It will include a spatial component that integrates with roads and highways. It will also offer the user the ability to look at different STIPs: current, scenario, and future. The project details screen will walk the user through the data entry process with a wizard-type format. The STIP Manager will also integrate with the State’s SAP accounting system. The system also accommodates different user roles that provide varying degrees of access. All project edits will be made directly in the STIP Manager.
Figure 3: NCDOT STIP Map
Source: https://ncdot.maps.arcgis.com/apps/mapviewer/index.html?webmap=cb02f4f828974670ad01bb83be91b18c.
Return to Top
Peer Presentations: Day 2
Missouri Department of Transportation (MoDOT)
Missouri’s STIP involves coordination with the State’s 9 MPOs (6 bistate) and 19 Regional Planning Councils (RPC). MoDOT is governed by independent commission. Project needs are identified at the local level and then prioritized at the district level for inclusion in the STIP. MoDOT’s Transportation Management Center (TMS) was started in 1994 and has been developed completely in-house. The TMS is continuously updated and includes integration with an Oracle relational database, LRS, and geospatial capabilities.
LRS is at the core of the TMS and is maintained by a team of GIS staff. The LRS is built off a collection of nodes. Every road in the LRS is bidirectional. Each road is given a route ID, which can be used to join data from Oracle. STIP projects are assigned beginning and end measures from the LRS, which allows them to be mapped and to be associated with the Oracle database.
MoDOT’s STIP Information Management System (SIMS) is built in-house with Oracle on the back end. Mapping functionality is built using ArcGIS Pro. Updates are made monthly. To create a project in SIMS, users select the project location by selecting relevant routes and identifying beginning and end points from a map. For projects that are not on the LRS, users manually draw lines.
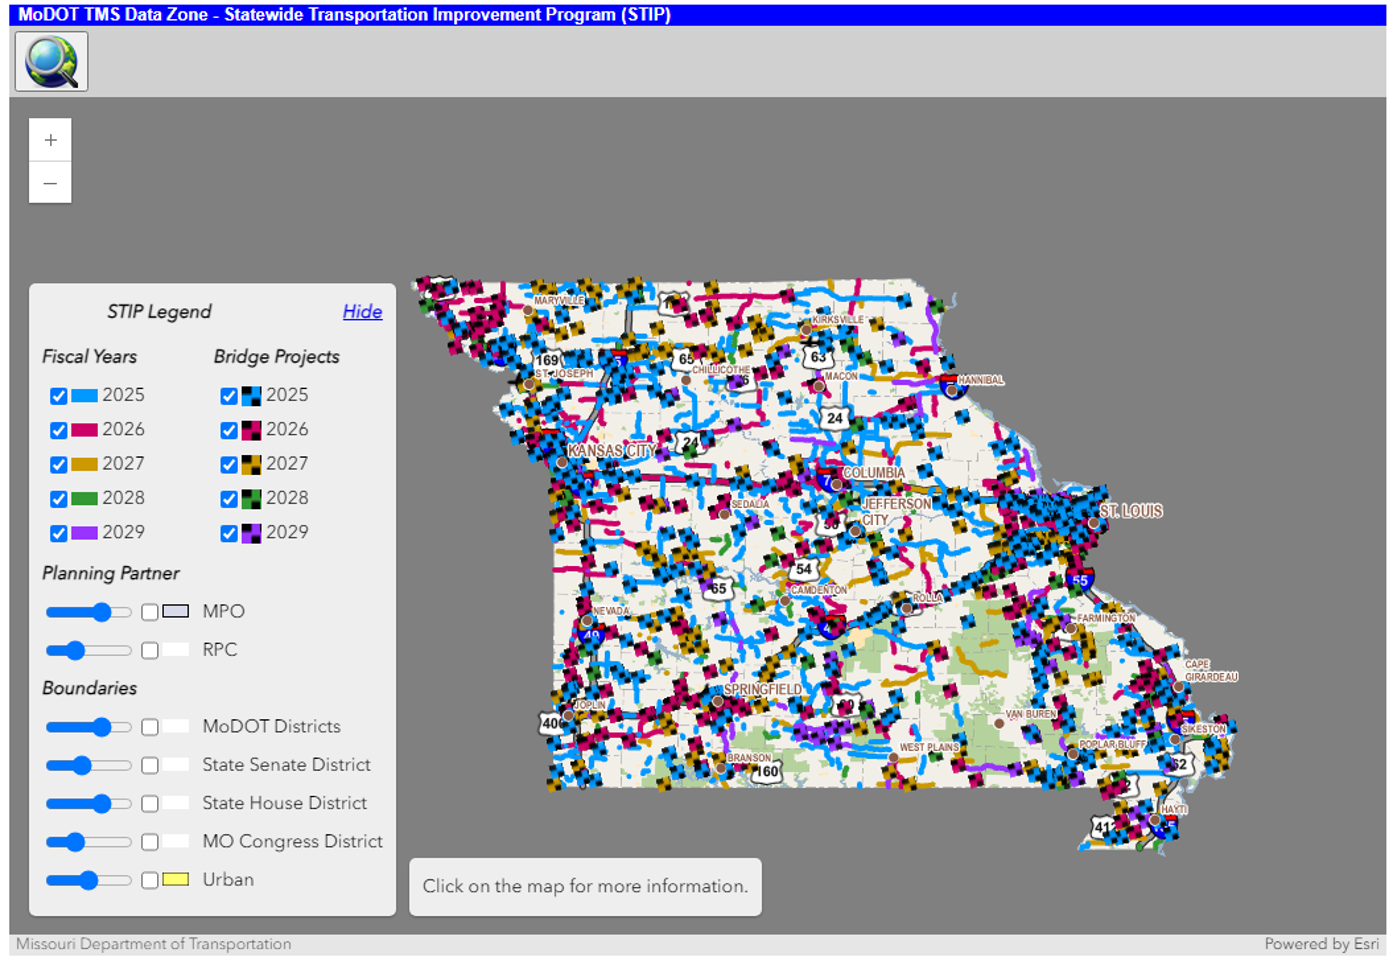
The SIMS tool allows MoDOT to easily perform what-if scenario planning and to make budget/funding updates. It also helps the State quickly produce its annual documentation and to generate custom maps for senior management or legislators. MoDOT provides the public with various geospatial data products, including the STIP interactive public map as well as MoDOT Data for TMS data.
The SIMS tool has also been used to conduct conflict of interest analysis. The properties owned by the independent commissioners are tracked and are assigned buffers to identify projects for which each commissioner may have a conflict of interest. That is, commissioners are not allowed to vote on projects that fall within their property buffers. SIMS is able to quickly develop a report of such properties.
MoDOT maintains a list of high priority unfunded projects that are next in line for funding when it becomes available. Unfunded needs are tied to the LRS so they can easily be transitioned to the STIP when they receive funding.
MoDOT hopes to expand its ArcGIS Online offerings.
Figure 4: MoDOT Interactive STIP Map
Source: https://www.modot.org/statewide-transportation-improvement-program-stip.
Return to Top
Rhode Island Metropolitan Planning Organization (RI MPO)
Rhode Island Division of Statewide Planning (RIDSP) is the only MPO for the State of Rhode Island (RI MPO). The MPO’s boundaries align with the State’s, so RI MPO has a unique collaborative relationship with RIDOT. The State’s STIP is rewritten every four years and was last updated in 2021. GIS has been taking a larger role in the planning process. RI MPO offers three primary GIS-based services: STIP Project Dashboard, eSTIP Manager, and Statewide Intake Framework for Transportation (SWIFT).
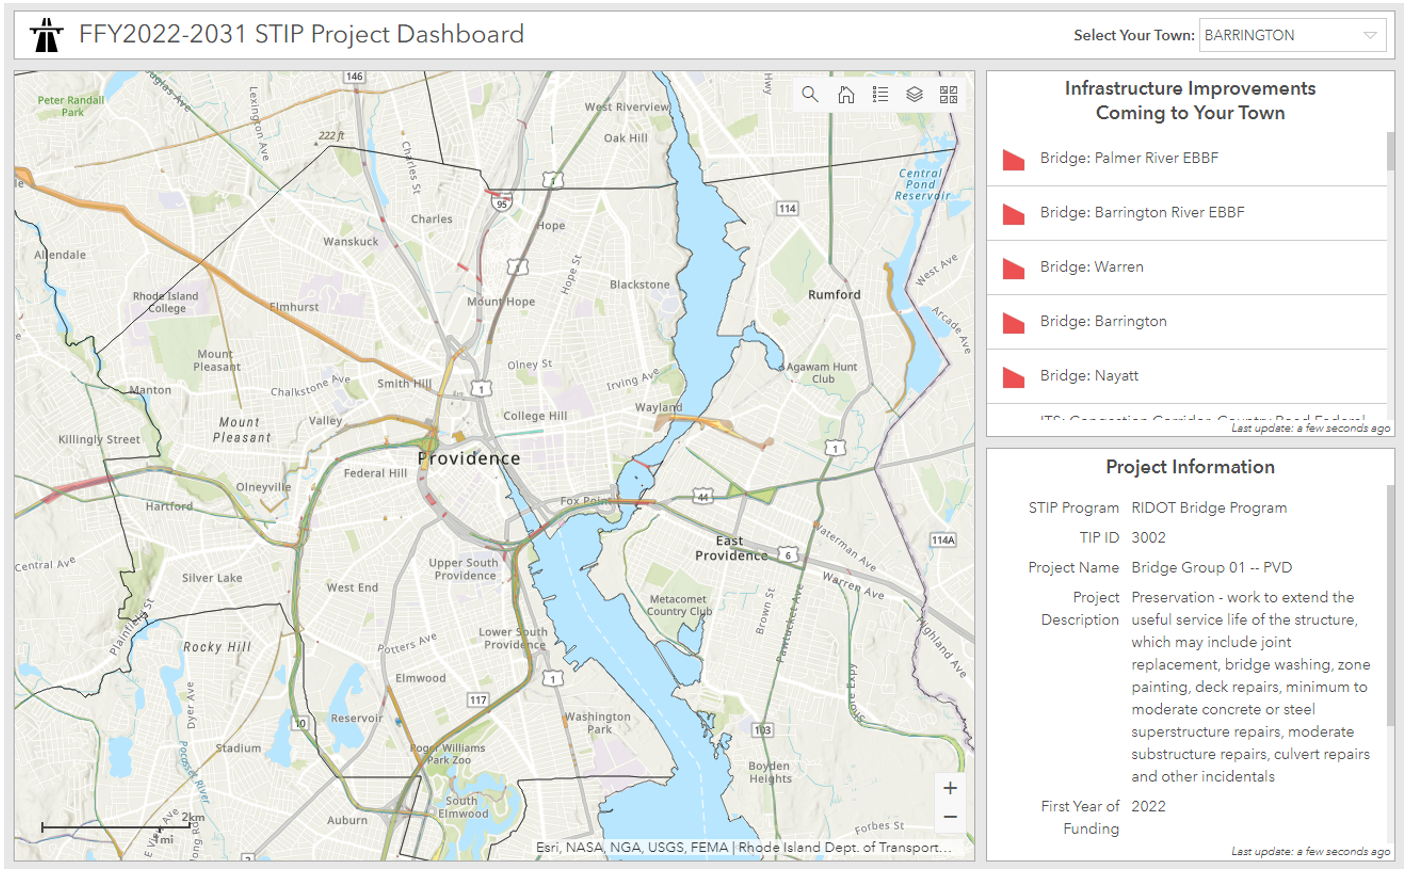
The STIP Project Dashboard is where projects are mapped and available online for public viewing. Asset geometry is live. The Dashboard is about five years old and is a placeholder as the State build’s out the eSTIP viewer.
Figure 5: Rhode Island STIP Project Dashboard
Source: https://risegis.ri.gov/portal/apps/opsdashboard/index.html#/a2122bbbf1434cd6b73d6b2216458c1b.
Rhode Island has been working with PMG for a number of years to develop the eSTIP viewer. It is almost finished and will be available to the public soon. This tool will be particularly useful to manage STIP reporting and amendments. The eSTIP viewer makes it very easy to see different sources of funding. It also features a staging for projects that are being amended before they go to pre-approval.
The Statewide Intake Framework for Transportation (SWIFT) is underway (in testing) and being finalized. This represents a big step forward relative to the former project intake system that was performed with fillable forms and drawn maps. SWIFT is intended to be a set of two different applications. On the DOT side, SWIFT will automatically score projects based on project location, taking into account flooding, congestion, and other metrics. The intake tool will also feed a project bundler that RIDOT is working on, which consolidates projects based on timing and location. From the applicant side, SWIFT provides a wizard to walk through the process of submitting a project.
This wizard offers applicants the ability to sketch a project, including a “zone of disturbance” on which geoprocessing and scoring is performed.
RI MPO finds that GIS is improving STIP efficiency and consistency. For example, GIS is being used to bundle projects to more efficiently allocate funding.
RI MPO and RIDOT are working on a set of best practices for applicants regarding how to buffer assets to define a project’s “zone of disturbance.”
Return to Top
Oahu Metropolitan Planning Organization (Oahu MPO)
Oahu MPO is one of two MPOs in Hawai’i. The agency’s primary partners are Hawai’i DOT (HDOT), Honolulu Department of Transportation Services (HDTS), and Honolulu Authority for Rapid Transit (HART). The TIP is revised annually and updated every three years. The project scoring process ensures that the TIP aligns with the region’s long range plan’s visions, goals, and objectives, taking into consideration a variety of factors, including crash rates, EJ communities, walk zones, sea level rise, freight zones, and population demographics. Oahu MPO primarily uses GIS to score projects and as a tool for stakeholders to visualize where projects are located.
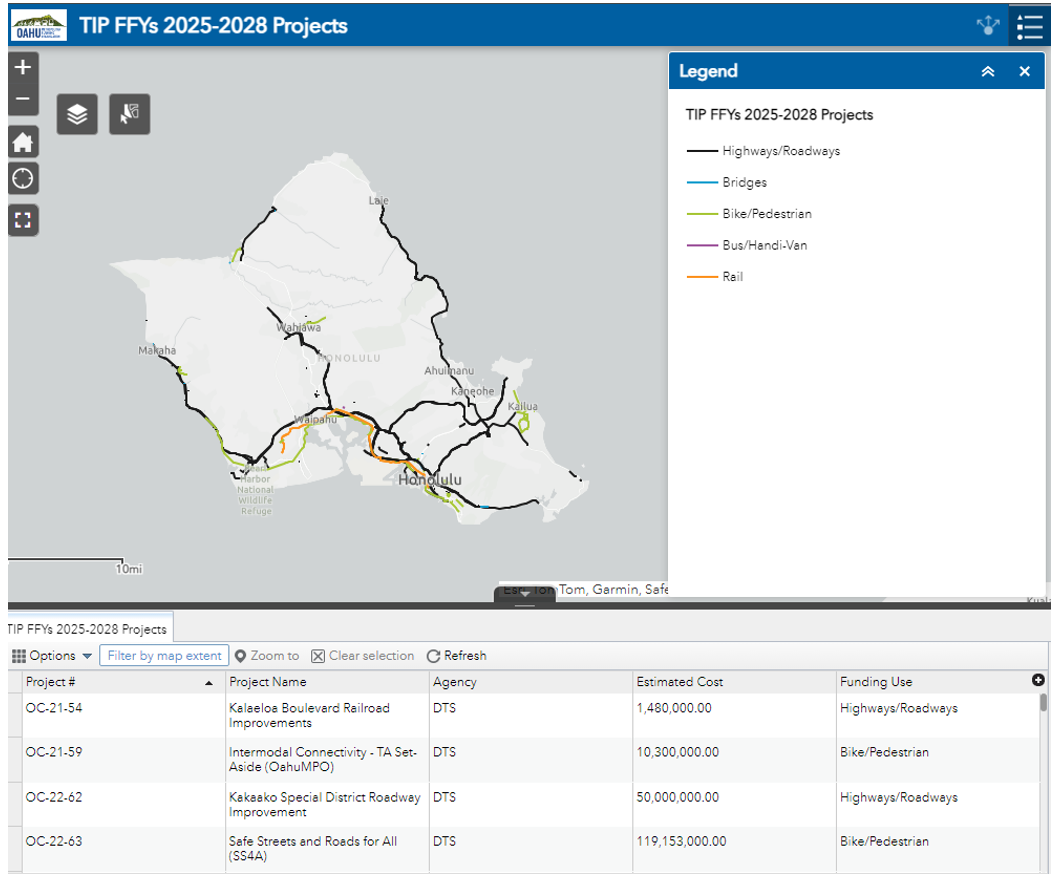
Project locations are mapped manually using ArcGIS Pro and then shared Online for stakeholders. Some projects do not have precise locations, but they are still incorporated in the online system for visibility. Oahu MPO currently uses ArcGIS Web Map Builder but may transition to Experience Builder in the future.
Figure 6: Oahu MPO TIP Interactive Map
Source: https://www.arcgis.com/apps/webappviewer/index.html?id=70dcee143411420b9c1e0790876e68d5&extent=-17701937.1748%2C2381559.6369%2C-17408418.9862%2C2468239.227%2C102100.
Return to Top
Peer Presentations: Day 3
Oregon Department of Transportation (ODOT)
ODOT uses GIS in three stages. The first is pre-STIP during project selection. As projects are selected and combined, they are handed off to the GIS team for georeferencing and some manual digitizing. These pre-STIP projects are published on ArcGIS Online through the internal Fix-It Scoping Tool.
Next, the internal Project Location Tool is used to accurately enter and formalize STIP project locations. Where possible, projects are linearly referenced. This tool is a significant improvement over the formerly manual work. The Project Locator Tool references and visualizes a non-GIS database. Currently, projects can only be tied to the LRM for state-owned routes, but ODOT intends to expand this to non-state routes in the future. When a project is created in the tool, it is broken into various geographies along municipality boundaries. This allows each agency to see their STIP project locations separately. Once the project locations are created, they are loaded back into the STIP database. Although applicants can perform manual location entry, it is not recommended.
The last stage where GIS is used is to share information about approved STIP projects with the public. This STIP data is available through several applications built in-house as well as various ArcGIS Online applications. These applications are all different, but they all point back to the same authoritative STIP data, which is pulled nightly.
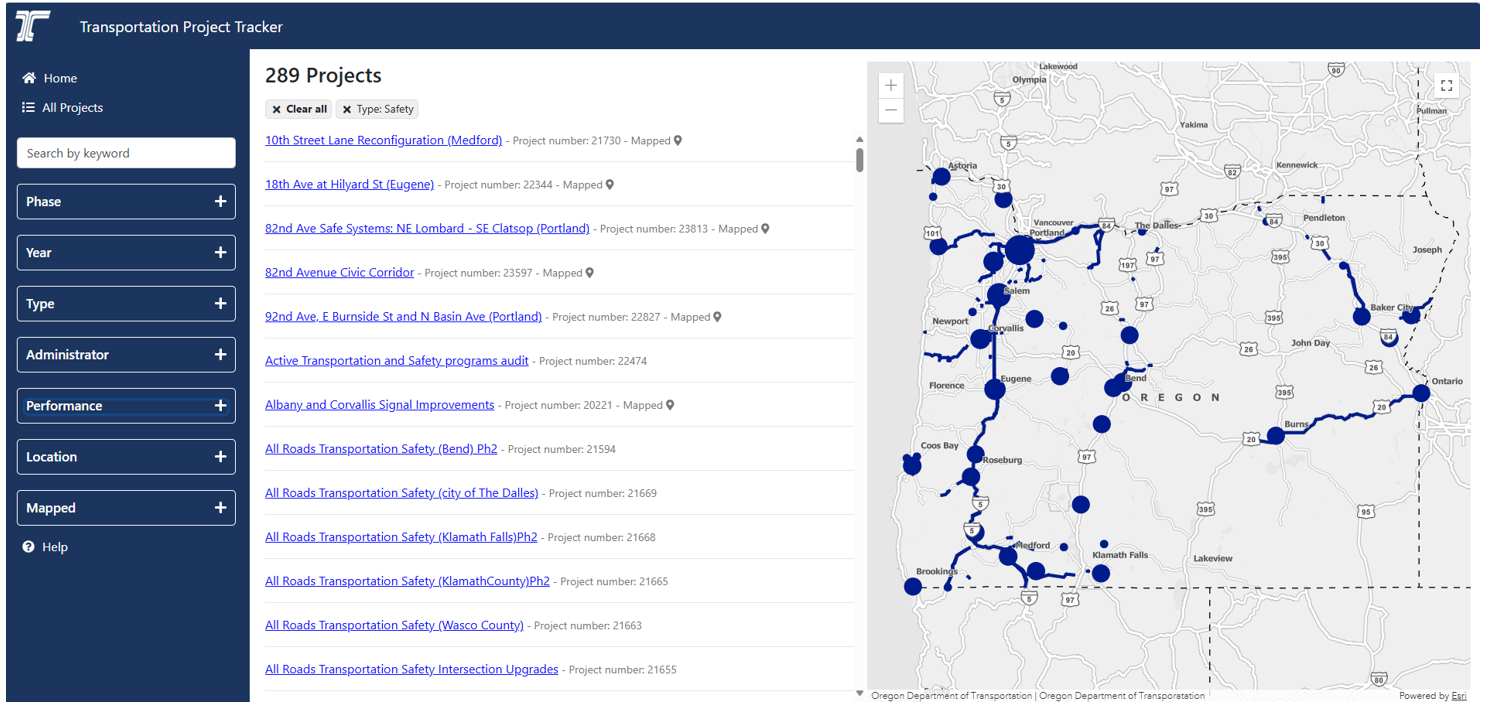
One such application is the Transportation Project Tracker, which is open to the public. Viewers can explore the interactive map displaying STIP project locations. Project geographies that were entered geospatially through the Project Location Tool are saved tabularly in the STIP database and then re-presented geographically in the Transportation Project Tracker. Viewers can also click on a project to learn more about it. Project information available is pulled from various sources, including project websites, the STIP database, the ODOT financial system, and more. For each selected project, viewers can see contact information, project websites, description and title, and spent-to-date amounts.
Other applications include:
- TransGIS. ODOT’s flagship general transportation application. This public tool includes over 100 layers with authoritative data.
- FACS-STIP. This includes the Asset Reports tool, which allows users to select certain start and end mile points to generate various asset reports.
- Oregon Transportation Safety Data Explorer. This public tool helps to identify corridors with high crashes and this data can be compared to the locations of planned or in progress transportation projects.
- Tribal Employment Rights Office (TERO) Tool. ODOT provides STIP data to TERO so that Oregon Tribes have the option to bid on projects within their TERO boundary. TERO boundaries are negotiated buffers around reservations. This tool is internal.
Figure 7: ODOT Transportation Project Tracker
Source: https://gis.odot.state.or.us/tpt/projects?type=Safety.
ODOT identified several shortcomings in their existing GIS systems. One is that the STIP Project Locator tool does not include automated location change detection. This means that when project locations change, ODOT must manually communicate this via email. Similarly, if legislative boundaries change or the LRS is modified, ODOT must make manual changes to STIP project locations; this does not directly feed into the STIP. Similarly, there is no feedback loop between the STIP and the LRS, meaning the completed STIP does not feed into the LRS. Finally, ODOT’s systems are not effective at communicating the “why,” i.e. the reason for a change in the STIP.
Despite these shortcomings, ODOT has found GIS to be highly beneficial in improving the efficiency and accuracy of the STIP planning process. For example, GIS makes it easier for members of the public to review STIP information and catch errors.
Return to Top
Pennsylvania Department of Transportation (PennDOT)
PennDOT noted that ODOT’s workflow is very similar to their own. The State’s internal system is called PennDOT Connects. As its name suggests, the tool connects needs identified by the public to the State’s internal transportation need capturing system. This pre-STIP activity also includes considering National Environmental Policy Act (NEPA) requirements. One of PennDOT Connect’s main successes is that it incorporates GIS. In order to assist business units in the use of the Connect tool, PennDOT has developed a variety of tailored templates which loads in a sample of data layers relevant to different activities and roles. To develop these map templates, PennDOT spent time with the different business units to identify the workflows and service definitions necessary for their work.
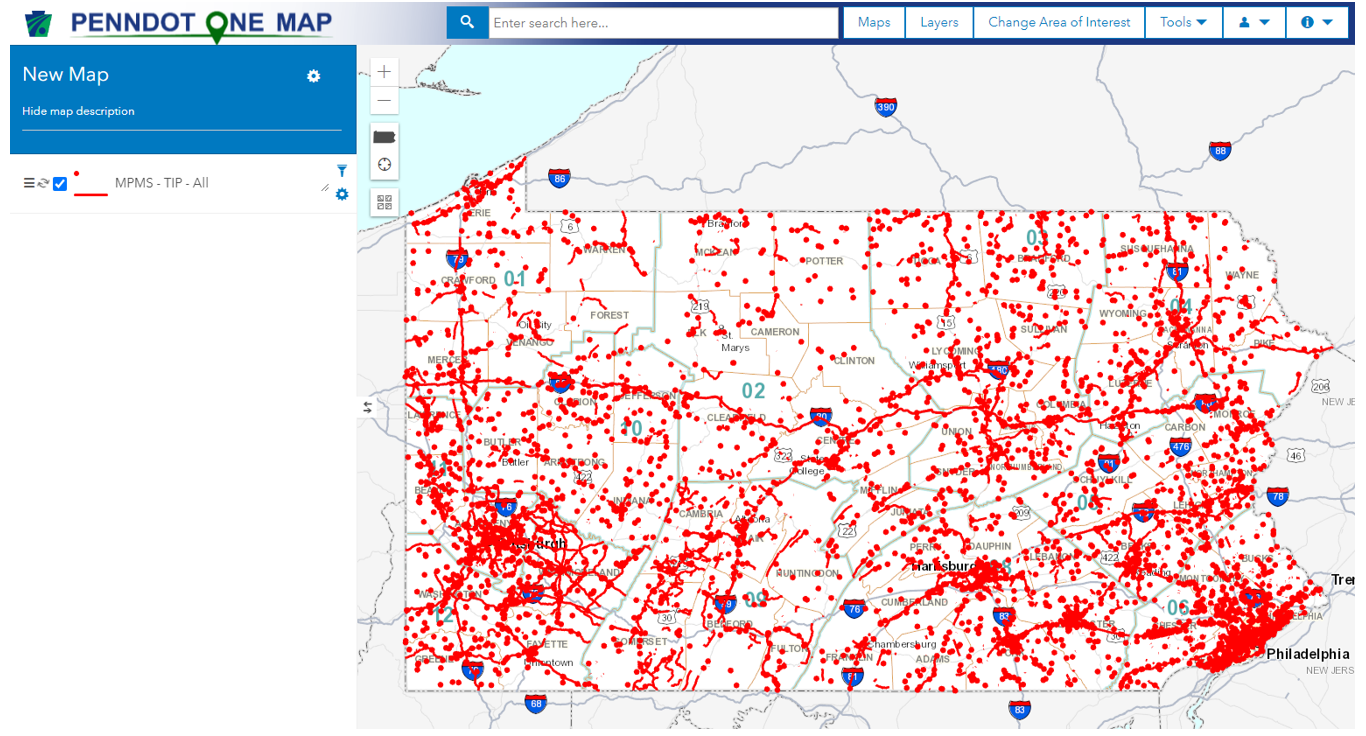
The PennDOT One Map is the State’s primary public-facing tool. This GIS-enabled, mobile-friendly application ensures transparency in the State’s STIP process. Users can select projects and run reports, identify contact information, view live video feeds, and open Google Street View. PennDOT also offers its PA Projects tool which shares information about shovel-ready STIP projects, including construction and asset management data.
Figure 8: TIP Layer on PennDOT One Map
Source: https://gis.penndot.gov/onemap/.
PennDOT develops its own in-house basemaps for its GIS products, which incorporates the State’s LRS. This basemap is set as the default on PennDOT’s tools.
Return to Top
South Dakota Department of Transportation (SDDOT)
South Dakota updates its fiscally constrained STIP every four years. The State also produces a developmental STIP for scoping purposes, which covers years five through eight. Together, these two public-facing STIPs cover 8 years of planned projects. Internally, SDDOT also maintains a database of long-range projects that are not programmed within the next 8 years.
SDDOT’s STIP management tool is called Concept to Construction (C2C). This backend tool requires manual entry. C2C also allows users to run reports, including STIP revisions, and export data to Excel. This is the main way the State manages its STIP. Although this Excel data is available on the SDDOT website, the State recognized that this was a clunky and static way to communicate the STIP. So, SDDOT introduced GIS maps to improve how STIP information is presented to the public and to better visualize STIP changes.
SDDOT’s STIP maps include an internal interactive needs map, an internal long-range STIP map, an internal proposed STIP map, a public fiscally constrained STIP map, and a public developmental STIP map. These STIP maps are updated once or twice a week. These maps pull tabular data from C2C, including project beginning and end markers. SDDOT uses each project’s identified improvement type in C2C to symbolize projects. Currently, SDDOT uses ArcGIS Map Builder for its public maps but intends to transition to Experience Builder soon. The State is troubleshooting how to maintain the correct symbology when data is published as a feature service in Experience Builder. Another priority is making the State’s STIP maps mobile friendly.
Figure 9: SDDOT STIP Map
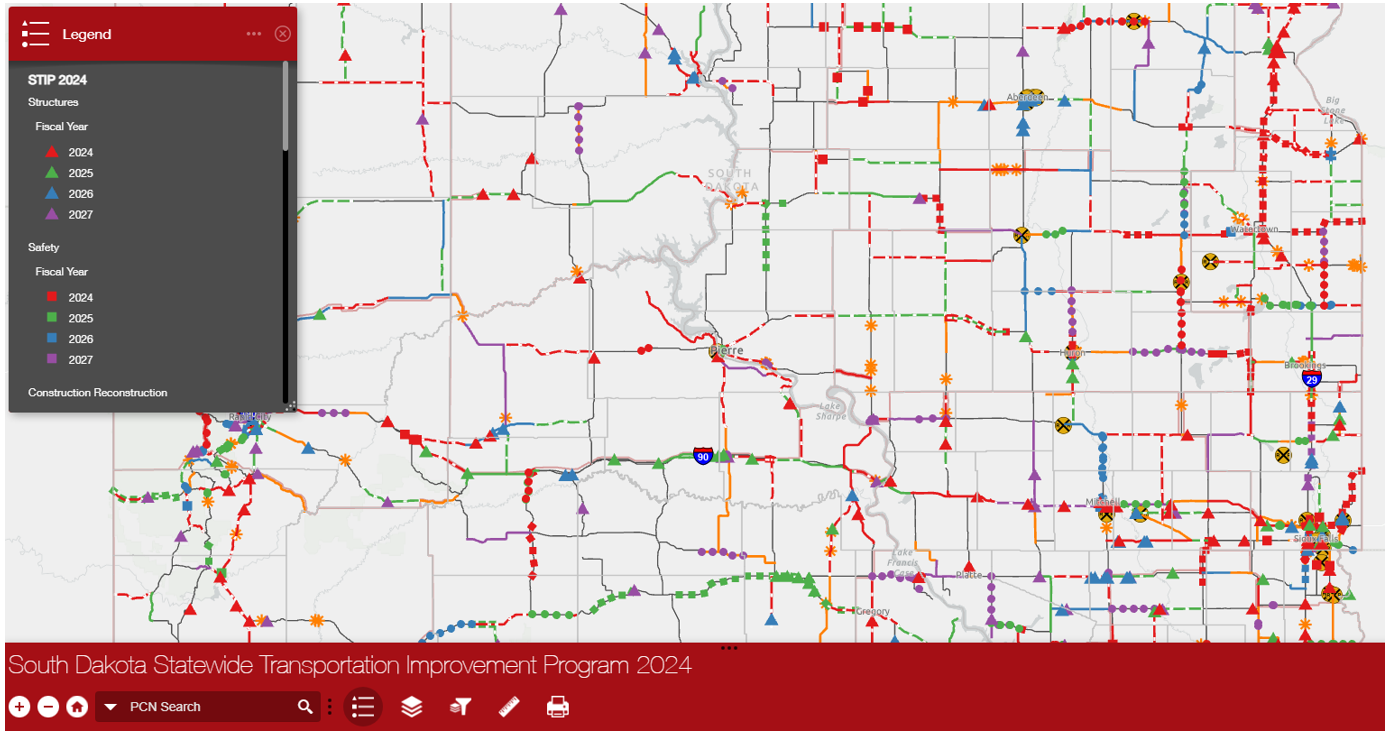
Source: https://sdgis.sd.gov/portal/apps/webappviewer/index.html?id=04101b0bcc6e473b9121c4a454b57002.
SDDOT noted that their GIS office consists of two staff. Despite its small size, this office has been effective at maintaining high-quality map products. SDDOT also noted that they are in the early stages of replacing its C2C system with an updated eSTIP tool and was interested in hearing lessons learned from other States. SDDOT recognized that, as noted by other States, transitioning to a tailored eSTIP can be complicated and time-consuming both for procurement and development.
Return to Top
Summary of Themes
There are a number of themes that were mentioned by multiple participants, and that emerged as important considerations for portal management:
- GIS and spatial analysis can be leveraged to improve the project scoring and cost estimation process. For example, GIS makes it easy to compare STIP project locations with a plethora of other geospatial datasets, including EJ, environmental, and administrative/legislative boundaries.
- Many States develop different sets of internal and external GIS products for each stage of the STIP process. These products generally point to a single, authoritative source of STIP data and can incorporate a variety of other data, including contact information, accounting information, administrative/legislative boundaries, and EJ and environmental data.
- Many States use their own LRS to geolocate STIP projects. Often, eSTIP systems allow applicants to click on an interactive map to select portions of the LRS where their project will occur. When projects are introducing assets that do not yet exist on the State’s LRS, applicants may need to manually draw their project geographies.
- States also leverage GIS to improve workflows in unique ways. For example, MoDOT uses GIS for conflict-of-interest analysis, and ODOT uses GIS to identify projects where tribes are offered prioritized bidding.
- Thanks to improvements in the accessibility and user-friendliness of GIS platforms, GIS products make it easy to transparently share STIP information with the public. Moreover, agencies of all sizes can leverage GIS tools to improve their STIP processes.
- Many States are developing tailored eSTIP managers, which can require complicated and time-consuming procurement and development processes.
- GIS is helping States improve the efficiency, accuracy, accessibility, and transparency of STIP processes.
Return to Top
Appendices
Appendix I: Peer Exchange Agenda
| Tuesday, August 13, 2024 |
| 1:00 PM |
Introduction and Agenda Review: FHWA, Mark Sarmiento |
| 1:15 PM |
Massachusetts DOT Presentation |
| 2:00 PM |
Michigan DOT Presentation |
| 2:45 PM |
15 Minute Break |
| 3:00 PM |
North Carlina DOT Presentation |
| 3:45 PM |
Discussion |
| Wednesday, August 14, 2024 |
| 1:00 PM |
Introduction and Agenda Review: FHWA, Mark Sarmiento |
| 1:15 PM |
Missouri DOT Presentation |
| 2:00 PM |
Rhode Island MPO Presentation |
| 2:45 PM |
15 Minute Break |
| 3:00 PM |
Oahu MPO Presentation |
| 3:45 PM |
Discussion |
| Thursday, August 15, 2024 |
| 1:00 PM |
Introduction and Agenda Review: FHWA, Mark Sarmiento |
| 1:15 PM |
Oregon DOT Presentation |
| 2:00 PM |
Pennsylvania DOT Presentation |
| 2:45 PM |
15 Minute Break |
| 3:00 PM |
South Dakota DOT Presentation |
| 3:45 PM |
Discussion |
Return to Top
Appendix II: Peer Exchange Participants
Presenters
Facilitators
Other Attendees
Return to Top





