A Newsletter from the Federal Highway Administration (FHWA)
Printer-friendly PDF →
Our guest writers this month are from the South Dakota DOT (SDDOT) and the Colorado DOT (CDOT). This edition’s focus is on mobile data collection.
Winter 2024
Spotlight: Collecting Field Data: A Better Way
Article by Kimberly Zerr, GIS and Transportation Data Manager, South Dakota Department of Transportation (SDDOT)
In 2014, I was approached by the South Dakota Department of Transportation (SDDOT) Railroad Safety group with a problem. They were looking for a better method to gather, store, and analyze railroad crossing data. At the same time, the Department was moving away from the mainframe databases we had been using for decades. We were looking for ways to improve how we managed our asset inventories. Historically, the SDDOT used spreadsheets or paper forms to gather data in the field and manually entered the data into mainframe databases. There were inconsistencies in data gathering, problems merging spreadsheets and paper forms, and issues mapping data from the mainframe.
I started experimenting with ArcGIS Online and Collector for ArcGIS, and the rail crossing inventory was the perfect dataset to test out my new mobile collection skills. Our crossing inspector was taking a laptop, several notebooks, and a camera on his inspections and manually entering his collected information. We knew we could reduce the equipment and time he was spending. With the help of our centralized IT department and the state GIS coordinator, we deployed Collector on an iPad.
Initially, we took the fields exactly as they were and put them in Collector as mostly fill-in boxes and a few dropdowns. As we became more proficient with data collection, we realized that converting paper forms to mobile collection was not a one-to-one method. We assigned domains to data fields to reduce errors and create standardization in data entry. The domains made the data easier to query by office staff and decreased the number of errors we saw based on mistyped responses. We also created new fields to accommodate inspection notes.
The feedback from the rail safety engineer and the crossing inspector was positive. After they decided to continue using Collector for the next season, we considered moving more of our field collections to Collector. Our next task became moving our Highway Performance Monitoring System (HPMS) inspection data. The HPMS inspection application became an even bigger success than the railroad crossings. After that, we moved our sign and culvert collection to Collector and gained dozens of users across the state.
Most of our applications transitioned seamlessly to Field Maps, and the similarity to Collector eased the transition to Field Maps for our less tech-savvy field staff. Some applications improved with the introduction of form-building capabilities, as smart forms made it simpler to get responses within accurate parameters. With the form builder, we can create logic and use a map-based format for collection so our users can see where they are in relation to existing assets while in the field. We have the flexibility to do different types of multiple-choice questions like combo boxes and radio buttons, we can provide hints, and we can require answers for certain questions before allowing users to submit or save their records. Survey123 provides more flexible form-building capabilities, but the simplicity for displaying existing data in a map-based format isn’t close to Field Maps.
Our SDDOT staff who use Field Maps praise the benefits of the app. Our guardrail inspectors say the use of Field Maps minimizes the time spent at structures and in traffic and reduces the time spent doing data entry in the office. The ability to easily attach photos to inspection records is helpful when figuring out how to repair damaged guardrail. Our pavement distress inspection team likes that Field Maps works both online and offline, so if they plan to be in an area with poor or no cell service, they’re still able to work, and their data is automatically synced with the database when cell service resumes. With GPS (global positioning system) location tracking, their drivers can focus on driving instead of using a DMI and mileage reference markers to determine location. The default accuracy makes them confident that they’re inspecting the correct sections. That’s also a benefit for our HPMS inspectors. For them, using Field Maps makes it easier to find segments and their associated data items, instead of flipping through papers looking for the segment numbers.
Field Maps has made our data collection easier, more accurate, and safer. Today, our GIS Team has more than 10 Field Maps applications in production. In addition to railroad crossings, we have inspection apps for guardrails, pavement distress, HPMS, damage assessment, signs, culverts, maintenance repair locations, and others. While our team is not actively looking for new applications, we have a few in the works for other asset inventories and traffic monitoring activities. We also just launched an internal SDDOT GIS Hub site with information on all our Field Maps applications. Our experiment with railroad crossings led to a field data makeover at SDDOT, and the introduction of Field Maps has our made mobile collection even better.
Back to Top
CDOT’s Mobile Development Program: Field Applications for Asset and Environmental Data Collection
Article by Roberto Avila, GIS Applications & Data Services Unit Manager, Colorado Department of Transportation (CDOT)
Source: CDOT
The collection of spatial and non-spatial transportation data is critical and, if not addressed properly, it results in operational complications that can affect DOTs’ business budgeting and planning. The Colorado Department of Transportation (CDOT) is no exception.
Asset data collection is being addressed by the Division of Management Operations (DMO) asset group and the Division of Transportation Development (DTD) as the Information Technology support group. Some projects supported by these groups include the collection of sign data using Gitac data recorders and the collection of ADA curb ramp and culvert line features using Trimble Juno devices. Even though these were sound projects, technological advances during that time were manual; field data collection of signs, curb ramps, and culverts was a slow process and prone to errors. It took months for the Feature Layers to be displayed on our ArcGIS Online Organization (C-Plan). In lieu of the inefficiencies within the data collection effort, there was a need to automate and integrate asset data. This required that a system could handle project- planning, workforce coordination, and dispatching, collecting, storing, validating, and following-up on real-time data collection operations. Environmental Systems Research Institute (ESRI) mobile applications were a good fit for what CDOT needed. These configurable applications are a quick, secure, and efficient way to inventory asset roadway data at the statewide programmatic level.
Source: CDOT
In 2017, a formal mobile data collection program led by the GIS Applications and Data Services Unit (ADSU) was initiated using two popular ESRI mobile applications: Survey123 and Collector for ArcGIS. The effort was greatly improved and expanded by the System of Engagement (SoE), an ESRI support initiative to empower hardware, software, and geospatial information technology needs using ArcGIS Enterprise. The SoE included back-end authoritative, updated, and easy-to-use asset data that could be consumed by more than 80 apps. The SoE was implemented over the next few years to include hardware and software in Amazon Web Services (AWS). The system relies on ESRI’s Geographic Information System (GIS) spatial components to collect, store, maintain, integrate, and share data. The main objective of this effort was to have an app for every single asset type to be used for any asset group that needed it.
CDOT asset groups became excited about this technology once they understood that data collection cases that previously took four to six months to complete could be completed in just a few minutes. Field data collection efficiency was exponentially improved and well-received by CDOT asset groups after the implementation of Esri’s Field Maps, Survey123, and QuickCapture mobile applications. As the program progressed, data previously collected using paper and pencil could be migrated to a modern data collection mobile framework. For example, ArcGIS Online user licenses jumped from 110 to 300 users within a couple of months. The Unit received various new application requests and the SoE highlighted the need to develop CDOT internal ArcGIS Enterprise-based applications. In addition, the updated status was displayed in real-time to any CDOT manager or the public by viewing the results through infographics displayed in online dashboards. Managers are able to view asset listings based on status, asset types, and personnel assigned.
Source: CDOT
This technology helped build a GIS-educated and technology-minded workforce. CDOT users are increasingly engaged in asset data collection, inspection and maintenance using state-of-the art geospatial technology. This geospatial technology project has benefits not only for the CDOT workforce, but also for the broader public. CDOT users of the system can use and consume the data via mobile applications to see what maintenance or inspection items are assigned to them, and where those items are located in the field. When the user completes a task, they can update the status in the application and consequently the enterprise database. Examples of public benefits include:
Source: CDOT
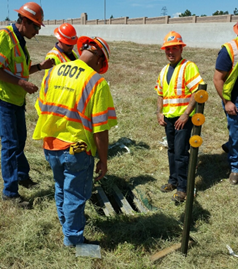
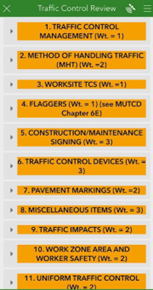
- The Traffic Control Review Report allows project teams, resident engineers, and the annual traffic control review teams to assess the quality of temporary traffic control on CDOT and maintenance projects based on how it aligns to current standards.
- The Roadkill app allows CDOT staff to report roadkill deaths on CDOT roadways quickly and easily. The information gathered is used to determine areas in need of mitigation such as crossings or signage. It is also shared with other agencies, such as the Colorado Division of Parks and Wildlife, to help determine wildlife population levels and movement patterns.
- The Illicit Discharge app reports illicit discharge findings throughout the State. CDOT responds to reports of illicit discharges that are included under Part 1.E.3.a.iv. of CDOT’s Municipal Separate Storm Sewer System (MS4) Permit. The information gathered helps to protect the Waters of the State from any pollutants that enter CDOT stormwater conveyances.
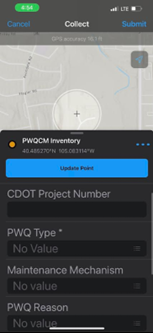
- The Permanent Water Quality Control Measures app is used to map and conduct Routine Annual or Compliance Inspections of CDOT permanent water quality assets. The information gathered helps to guide design standards, long-term operation and maintenance plans, meet MS4 requirements, and supports watershed-wide water quality protection efforts throughout the State of Colorado.
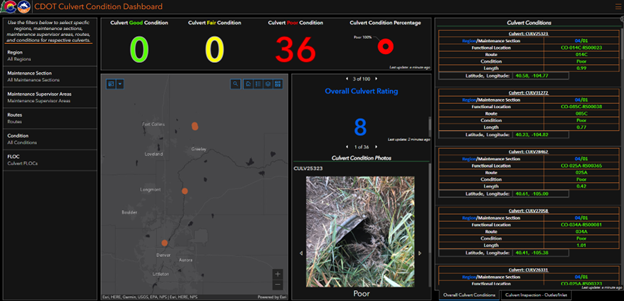
- The Culvert Condition app is used to identify culverts that are most at risk in the CDOT system, and develop recommended treatments and/or improvements to those culverts in order to reduce CDOT risk related to culvert failure.
CDOT has made a lot of progress in our capacity to sufficiently provide online and offline mobile field data collection assets that are integrated with the existing asset inventory and financial applications. We are at the cutting edge of technological advances in transportation, focusing on simple, efficient, and robust mobile and server applications. Also, innovative asset data collection methods like photogrammetric road characteristics extraction, remote sensing analysis and modeling, LiDAR and Drone technology are to be implemented in the foreseeable future.
Back to Top
Other News
Event
2024 AASHTO GIS-T Symposium, Atlanta, Georgia, April 2–5, 2024
For more information about this newsletter, please contact Mark Sarmiento, FHWA Office of Planning, at Mark.Sarmiento@dot.gov.
Back to Top


