APPLICATIONS OF GEOGRAPHIC INFORMATION SYSTEMS (GIS) FOR LIVABILITY
Case Studies of Select Transportation Agencies
March 2011
REPORT NOTES
Acknowledgments
The U.S. Department of Transportation John A. Volpe National Transportation Systems Center (Volpe Center), in Cambridge, Massachusetts, prepared this report for the Federal Highway Administration's (FHWA) Office of Planning. The project team included Ben Cotton, Alisa Fine, and Carson Poe of the Volpe Center's Policy, Planning, and Organizational Analysis Center of Innovation.
The Volpe Center project team wishes to thank the staff members from several organizations nationwide, each listed in Appendix A, for providing their experiences, insights, and editorial review. The time they graciously provided was fundamental in preparing the case studies presented.
Research Approach
The project team used a multi-step process to identify case studies. First, potential case study efforts were identified based on a literature review and an internet scan of GIS applications that related to livability principles and had a transportation link. Other criteria used to identify potential case studies included geographic distribution (a greater geographic range was preferred) and the ways in which agencies were using GIS tools to meet livability objectives (a greater breadth of use was preferred). The team then, via telephone and email, assessed case study candidates' interest in contributing to the study. This outreach led to the project team's selection of four cases to study in more depth.
To conduct the case studies, the project team held telephone discussions ranging from 30 to 60 minutes with representatives who identified themselves as appropriate contacts. The project team tailored a flexible discussion guide to structure the interview conversations while allowing participants to talk about additional topics of interest. The team then compiled information from the discussions and relevant supplemental materials that interviewees provided to write the case studies. Interview contacts were provided an opportunity to review draft case studies and make any edits or revisions necessary.
TABLE OF CONTENTS
- REPORT NOTES
- EXECUTIVE SUMMARY
- INTRODUCTION
- FINDINGS
- CASE STUDIES
- MULTIMODAL CORRIDORS: THE CITY OF BOULDER (COLORADO) TRANSPORTATION DIVISIONS TRANSPORTATION MASTER PLAN GIS CORRIDOR ANALYSIS AND MAP IT APPLICATION
- LOCATION MATTERS: THE CENTER FOR NEIGHBORHOOD TECHNOLOGY’S (CNT) HOUSING AND TRANSPORTATION AFFORDABILITY INDEX
- PARTICIPATORY GIS: OREGON TRANSPORTATION RESEARCH AND EDUCATION CONSORTIUM (OTREC) AND UNIVERSITY OF OREGON'S ACTIVE TRANSPORTATION PLANNING
- TRANSIT ORIENTED DEVELOPMENT AND SCENARIO PLANNING: THE SOUTHERN CALIFORNIA ASSOCIATION OF GOVERNMENTS' (SCAG) CALIFORNIA LAND OPPORTUNITIES TRACKING SYSTEM (CALOTS) AND LOCAL SUSTAINABILITY TOOL
- OTHER APPLICATIONS
- APPENDIX A: LIST OF INTERVIEW PARTICIPANTS
- APPENDIX B: ADDITIONAL RESOURCES
- APPENDIX C: GIS TOOL CATEGORIZATION
EXECUTIVE SUMMARY
“Livability” is the idea that transportation, land use, housing, energy, and environmental considerations can be integrated to protect the environment, promote equitable development, and help to address the challenges of climate change. Geographic information systems (GIS) can support livability efforts by helping to convey complex transportation information to non-technical audiences, thereby allowing individuals to become more informed about their interaction with the built environment and ultimately make better transportation decisions.
This report synthesizes the findings from four case studies that assess how select organizations (the City of Boulder, Colorado's Transportation Division, the Center for Neighborhood Technology, the University of Oregon and the Oregon Transportation Research and Education Consortium, and the Southern California Association of Governments) are developing and applying GIS tools to support livability goals from a transportation point of view. The report identifies important trends and factors that encourage the use of these tools and provides examples of additional tools beyond those referenced in the case studies. Finally, it describes successes and challenges experienced in developing and utilizing the tools as well as factors that transportation organizations might consider as they engage in similar efforts.
While livability can be conceptualized in different ways, this report uses the definition that the U.S. Environmental Protection Agency (EPA), U.S. Department of Housing and Urban Development (HUD), and the U. S. Department of Transportation (DOT) have promoted. According to the partnership, livability involves providing transportation and housing choices, economic competitiveness, quality of life, and enhancing the unique characteristics of communities and neighborhoods by investing in healthy, safe, and walkable neighborhoods. The livability principles of particular relevance to transportation, and thus examined most closely in this report, include promoting transportation choices and enhancing communities and neighborhoods.
Key findings from case studies are summarized below.
- GIS tools can support livability in several ways, but generally have fallen into three broad categories: (1) decision-making; (2) highlighting connections; and (3) consensus building.
- Decision-making GIS tools typically provide information to users that allow them to make more informed transportation decisions, including what mode to choose to reach a specified destination most efficiently or cost-effectively.
- Tools that highlight connections focus on helping users comprehend intersections between transportation, the built environment, and other factors.
- Tools that support consensus building focus on collecting and sharing information among users to promote agreement on complex issues.
- Organizations developing GIS tools for livability might not frame their efforts as livability initiatives. Case study organizations reported that they did not explicitly label GIS applications as tools to support livability; rather, most organizations aimed more broadly to support livability-related concepts such as multimodalism or sustainability. Additionally, organizations articulated different definitions of livability, indicating the specific needs and characteristics of a community, neighborhood, or region strongly influence interpretations of livability.
- Few formal evaluations have assessed GIS tools for livability. While some organizations have field tested the tools or collected statistics on their use, these evaluations have generally occurred on an ad hoc basis. Most organizations have relied on informal or anecdotal measures to evaluate the success of GIS tools. More formal measures could be created by conducting evaluations on a regularly scheduled basis or documenting an evaluation scheme.
- GIS tools for livability provide an array of benefits, while only few challenges are experienced in their development. Case study organizations believed that the tools helped to make transportation information more accessible to a broader audience and supported a more transparent, collaborative, and participative planning process, among other benefits. While those interviewed experienced very few challenges in developing and managing these tools, some difficulties did stem from finding the resources to obtain expensive data and determining ways to organize, store, and display the information that was collected.
Findings compiled from the case studies generally show that GIS is an important tool that can support many livability goals in a transportation context, even as organizations are defining and interpreting livability in different ways. Newer geospatial technologies, such as those that allow spatial information to be more easily packaged, manipulated, analyzed, and disseminated to an end-user, have made it possible to develop these types of GIS tools. It is likely that GIS tools for livability will become more prevalent in both the public and private sectors as spatial technologies evolve and as livability and related concepts continue to become more commonplace in transportation planning practice.
INTRODUCTION
This report summarizes the results of a study conducted to assess how geographic information systems (GIS) applications are being used to identify, evaluate, and assess livability issues from a transportation point of view. The practices, challenges, and lessons learned in this study are expected to help others in the transportation industry identify and evaluate approaches to developing GIS applications for similar purposes.
The report provides background on important trends that are factoring into the creation of GIS tools that address livability topics and issues. It also presents findings from four case studies of selected organizations across the country and their development of relevant tools. The selected organizations and cases include:
- The City of Boulder (Colorado) Transportation Division's conversion of multimodal corridors to GIS for its Transportation Master Plan and development of a “Map It” application to visualize the interactions of these corridors.
- The Center for Neighborhood Technology's (CNT) development of the Housing and Transportation Affordability (H + T) Index, which assesses transportation and housing costs to provide a comprehensive picture of a neighborhood's affordability.
- The University of Oregon's and Oregon Transportation Research and Education Consortium's (OTREC) implementation of a series of “participatory GIS” tools that allow citizens to collect, input, and assess data related to their perceptions of the built environment.
- The The Southern California Association of Governments' (SCAG) creation of the California Land Opportunities Tracking System (CA LOTS) and local sustainability tool, which respectively support analysis of transit oriented/infill development opportunities and the effect of alternative development scenarios on greenhouse gas (GHG) emissions.
Finally, the report highlights additional examples of innovative GIS tools that support, promote, or further several livability areas, including transit tracking, vehicle sharing, and community visualization.
Background
On June 16, 2009, the U.S. Environmental Protection Agency (EPA) joined with the U.S. Department of Housing and Urban Development (HUD) and the U. S. Department of Transportation (DOT) to help improve access to affordable housing, more transportation options, and lower transportation costs while protecting the environment in rural, suburban, and urban communities nationwide. The partnership was founded on the idea that transportation, land use, housing, energy, and environmental considerations can be integrated to protect the environment, promote equitable development, and help to address the challenges of climate change—a concept alternatively known as “livability.”1
Together, DOT, EPA, and HUD developed six principles to promote and guide livability as a driving force in creating more sustainable communities. The principles are:
- Provide more transportation choices. Develop safe, reliable, and economical transportation choices to decrease household transportation costs, reduce our nation's dependence on foreign oil, improve air quality, reduce GHG emissions, and promote public health.
- Promote equitable, affordable housing. Expand location- and energy-efficient housing choices for people of all ages, incomes, races, and ethnicities to increase mobility and lower the combined cost of housing and transportation.
- Enhance economic competitiveness. Improve economic competitiveness through reliable and timely access to employment centers, educational opportunities, services and other basic needs by workers, as well as expanded business access to markets.
- Support existing communities. Target federal funding toward existing communities—through strategies like transit oriented, mixed-use development, and land recycling—to increase community revitalization and the efficiency of public works investments and safeguard rural landscapes.
- Coordinate and leverage federal policies and investment. Align federal policies and funding to remove barriers to collaboration, leverage funding, and increase the accountability and effectiveness of all levels of government to plan for future growth, including making smart energy choices such as locally generated renewable energy.
- Value communities and neighborhoods. Enhance the unique characteristics of all communities by investing in healthy, safe, and walkable neighborhoods—rural, urban, or suburban.2
A number of current transportation initiatives and techniques serve to advance these principles by investing resources in restoring community and vitality to cities and suburbs. A central theme linking all of these initiatives is an emphasis on “making places that work for people, not just for cars.”3 A sample of some of these initiatives and techniques are described below:
- Complete Streets,4 which the National Complete Streets Coalition advocates for and promotes streets that are accessible and safe for all users. In helping users feel more comfortable accessing streets and bolstering walkable communities, the Complete Streets Initiative plays an important role in supporting livability.
- Smart growth5 supports urban and transportation planning that concentrates growth in compact, walkable urban centers to avoid sprawl. It promotes housing choices that increase a neighborhood's aesthetic appeal and community character while emphasizing spaces that allow individuals from diverse walks of life, including both older and younger populations, to gather and socialize.6
- Sustainable development emphasizes social and economic equity as well as environmental quality. Transportation strategies are myriad and can include implementing transit or vehicle-sharing programs to reduce GHG emissions, strengthening land use and transportation connections through compact and transit-oriented development, or improving vehicle technologies to increase efficiency.7
- New Urbanism is an architectural movement focusing restoring urban neighborhoods and creating communities that are sustainable, efficient, prosperous, healthy, and incorporate historic preservation. Key New Urbanist strategies include advocating for public policies and development practices that support the above characteristics. Important transportation strategies include providing a network of transportation alternatives and maximizing connections between land and transportation.8
- Travel demand management principles9 aim to balance both growth and shifts in traffic to provide travelers with transportation options and a more efficient, reliable transportation experience. To do so, travel demand management emphasizes multiple strategies such as providing real-time information systems to travelers, developing route planning tools, or implementing infrastructure changes like transit-oriented development.10
GIS is recognized as a powerful tool to support these initiatives and others that fall under the umbrella of livability.11 GIS can translate complex transportation data into maps or applications that are visually appealing, meaningful, and accessible to a non-technical audience. In doing so, it can allow stakeholders to make better decisions, become more informed about their interaction to the built environment, and participate in creating data and analysis based on livability concepts.
This report focuses on GIS applications that have been or are being used to advance the transportation-related livability principles, particularly providing more transportation choices and valuing communities and neighborhoods.
GIS Research on Livability
There is a growing body of research and literature that explores how GIS can support transportation-related livability principles, spurred by increased interest in healthy communities, ways to adapt to or mitigate the effects of climate change, and strategies to address the obesity epidemic.12 Within this research there are increasingly prevalent emphases on collecting data at the street level, rather than at broader scales, and involving the public in GIS data collection, analysis, and assessment. Some recent analyses have demonstrated that:
- GIS illuminates important predictors for bicycling and walking. By mapping and analyzing biking and walking GIS data on a county scale, Zahran et al. found that bicycling and walking behaviors were strongly influenced by a combination of natural environmental factors, characteristics of the built environment, and socioeconomic conditions. While no factor alone was sufficient to predict rates of cycling or walking, the key potential predictors (when combined), included the presence of denser populations, natural amenities (e.g., warm winters, temperate summers, presence of a national park or forest), and college-educated residents.13
- GIS shows how proximity to transit-oriented developments (TODs) can affect real estate values. Researchers at the Mineta Transportation Institute looked at four TODs along transit lines in the San Francisco, California, area, and used GIS to measure proximity of homes to TOD areas and assess a combination of home characteristics (e.g., number of bedrooms, lot size, sale data). The researchers found that proximity to some TOD areas either had no impact or had a positive impact on single-family home real estate values. Proximity to one TOD area served by light rail increased the values of single-family homes; however, this effect was not found for the three other TODs.14 Other researchers have also found that walking proximity to community amenities, including grocery stores and libraries, increases real estate values in almost all markets.15
- GIS provides and captures valuable information about the built environment to help strengthen residents' sense of community. The Mineta Transportation Institute conducted a study with residents of Riverside, California, to understand how GIS could be used to help capture perceptions of the built environment, travel preferences, and preferences (e.g., on sidewalks). Based on the study, researchers recommended encouraging pedestrian activity and infill development for the Riverside community. The conclusions indicate that GIS can help residents make sense of complex interactions between travel behaviors and the built environment to illuminate community-specific strategies to benefit livability.16
FINDINGS
Interviews with case study organizations led to a number of findings in several areas, including how GIS tools are being used to support livability, paths organizations took in developing these applications, as well as challenges and benefits that organizations have experienced in using these applications.
GIS tools are being used in several ways to support transportation-related livability principles.
GIS tools can support livability in several ways, but these tools have generally fallen into three broad categories. These categories are not static and might shift over time as new technologies emerge and stakeholders' needs and interests change. Some GIS tools might also be characterized in more than one category. Despite the dynamic nature of these categorizations, they are useful as a conceptual mechanism to help broadly organize different GIS functionalities. The three categories are detailed below:
- Decision-Making. Many GIS tools for livability are being used to provide spatially based information that helps the public make better decisions about where, when, and by which mode to travel. For example, Boulder's Map It application, which is free and publicly accessible, shows transit routes, existing and proposed bicycle and pedestrian infrastructure, and locations of transportation projects in the city. In providing this information, Map It allows residents to make more informed decisions about how to travel, including where it might be safe to walk or bike and what transit routes lead to destinations the resident specifies. The tool also informs residents about upcoming transportation projects that may affect routing decisions or modal choices, in addition to supporting general community awareness of the impact of transportation on each person's daily life.
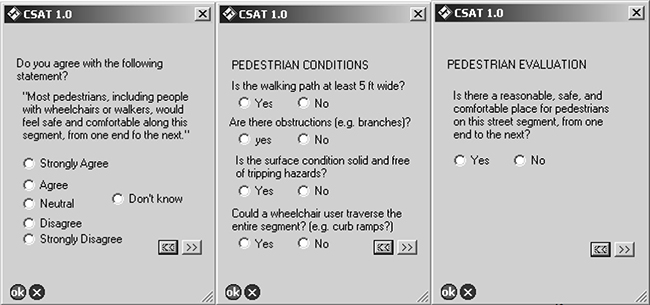
- Highlighting Connections. Many GIS tools for livability focus on helping stakeholders comprehend how various factors, including transportation, the built environment, and energy consumption, interrelate and interact.17 For example, the University of Oregon and OTREC developed a Complete Streets Assessment Tool (CSAT), which gathered data on how neighborhood residents experienced their built environment, such as pedestrian conditions, and their perceptions of that environment (e.g., perceptions of pedestrian safety). In the University of Oregon/OTREC case, CSAT was believed to have raised residents' awareness of the factors that make a neighborhood livable and empowered them to support policies that improve pedestrian infrastructure.
- Consensus Building. Many GIS tools for livability focus on collecting and sharing information among stakeholders to promote agreement on complex issues. For example, SCAG's local sustainability tool will allow local governments and others to create alternative development scenarios and assess their effects on vehicle miles traveled and GHG emissions. The tool was designed for use during workshops that will occur as part of SCAG's work to meet state requirements to plan for reducing GHG emissions and achieve emission targets. The tool generally supports stakeholders in collaboratively creating a collective land use and planning regional vision that is sensitive to GHG emissions.
Appendix C illustrates these categories with additional examples of GIS applications.
The six livability principles have informed organizations' work but have not prescribed the ways in which they have developed GIS tools for livability.
In all of the reviewed cases, development of GIS tools for livability predated the DOT, EPA, and HUD partnership and formalization of six livability principles. Many agencies noted that they have historically been involved in developing tools that support livability. For example, along with OTREC, University of Oregon professor Marc Schlossberg has been working since 2003 to develop a series of mobile GIS tools to map a neighborhood's conduciveness to biking and walking. Additionally, in 2003, the City of Boulder launched GOBikeBoulder, a website using GIS-based data that allows users to plan customized bicycle routes. CNT released an early version of its H + T Index for the St. Paul-Minneapolis, Minnesota, region in 2006.
Many agencies have not explicitly framed GIS applications as livability initiatives although they might support livability goals.
For example, the Boulder Transportation Division's effort to convert its multimodal corridors to GIS format supports livability goals, but the Division did not explicitly label this effort a livability initiative. Many GIS tools that support livability were designed to accomplish a range of goals not necessarily corresponding to the DOT, EPA, and HUD's six livability principles. Indeed, diverse factors have spurred development of GIS tools for livability, ranging from meeting policy mandates to completing a transportation plan update. SCAG developed CA LOTS and the local sustainability tool to meet state requirements to plan for GHG emission reductions as well as to support a regional program (Compass Blueprint) that seeks to promote livability, mobility, and sustainability. The City of Boulder converted multimodal corridors to GIS format as part of an update of its transportation master plan in 2003. The University of Oregon/OTREC case shows that development of CSAT and other livability audit tools derived from an interest in creating tools that allowed citizens to input data that reflected their experiences with the built environment.
Agencies believe there are many ways to define livability.
Each of the interviewed agencies articulated a different definition of livability, although there were recurring common themes (e.g., elements that make all transportation modes more convenient or accessible). For example, CNT asserts that livability hinges on urban form: a community is considered livable if people can walk, bicycle, or ride transit to access their destinations and rely less on motorized vehicles. The University of Oregon/OTREC case illustrates a slightly different perspective. The research team believed that livability is embodied by safety, convenience, social and housing equity, social capital, and housing capital, as well as how these factors contribute to conducive walking and bicycling environments. The variety of definitions indicates that many agencies are interpreting livability as it applies to the specific needs and characteristics of a community, neighborhood, or region.
Few formal evaluations have been conducted to assess GIS for livability tools.
Most evaluations of GIS for livability tools have focused on informal or anecdotal assessments rather than formal performance measures. In the University of Oregon/OTREC case, the research team discussed the successful and less successful elements of four GIS tools after each evolution of the tool. These tools were also field tested. SCAG reported holding an evaluation session to demonstrate CA LOTS and discuss potential improvements. Some agency representatives reported analyzing the use of online applications but most efforts have occurred on an ad hoc basis. For example, Boulder's Transportation Division occasionally collects information on the number of online “hits” Map It has received and CNT attempts to track the H + T Index's online use. The current use of more informal methods to evaluate GIS for livability tools suggests that there might be an opportunity for agencies to develop more formal methods, such as performance measures or evaluation criteria (based on either qualitative or quantitative data) that can help evaluate the success of a given application.
GIS tools for livability use different types of models for both data inputs and outputs.
Some tools use datasets that staff pre-load. While these types of tools generally do not offer opportunities for users to input their own data, they generally allow users to manipulate the data and customize the tool's outputs. For example, SCAG's CA LOTS tool includes data to support decision-making on transit-oriented and infill development. Users can choose several customized fields for which to conduct a search for infill opportunities (e.g., address, city, county) and can turn on or off a variety of layers (e.g., administrative boundaries, land use) when viewing maps. Some tools focus on allowing users to directly input data related to their experience of place. The University of Oregon/OTREC's livability auditing tools, including CSAT, all rely on citizen input about both objective information such as sidewalk width and curb cuts, as well as qualitative information pertaining to perceptions of environmental surroundings. The data model utilized in a tool primarily depends on the tool's purpose and objectives. A tool such as CSAT was specifically designed to apply a concept of “participatory GIS,” which aims to help cities and towns use residents' perceptions of the built environment to understand factors that make an environment conducive for walking or biking.
GIS tools for livability provide an array of benefits.
Organizations reported a wide variety of benefits to using GIS tools in support of livability-related goals, including the following:
- Tools, particularly those available online, have broadened access to livability-related data and made transportation information more accessible to a broader audience.
- Tools have informed residents' transportation decision-making, especially as related to modal or routing choices.
- Tools that collect users' data have helped engage citizens in a transportation dialogue and informed them about what factors in the built environment support or detract from desired outcomes.
- Tools have supported an overall more transparent, collaborative, and participative planning process:
Few challenges are experienced when developing GIS tools for livability.
Organizations did not report significant challenges in developing GIS tools; however, some difficulties did occur when obtaining data for applications and managing these datasets. In the University of Oregon/OTREC case, the research team reported a challenge in creating intersection data for each tool's basemap, and SCAG noted that it was expensive to purchase parcel-based information for CA LOTS, which is now typically available for free. Boulder's Transportation Division also noted some difficulty in developing a naming schema to data included in its Map It application.
Transportation organizations should consider the following factors when developing, improving, or managing GIS tools for livability:
- The DOT, EPA, and HUD livability principles can inform organizations' work on GIS tools and can provide a starting point for interpreting livability as it applies to a particular region or community. At the same time, however, agencies might want to consider how other factors, such as statewide mandates, could play a role in informing how the tools are created and how they interpret livability. An organization's previous work on livability-related concepts, including smart growth and TOD, provides a foundation from which the principles can help them expand or refine relevant GIS tools.
- There are opportunities to develop formal performance measures or criteria to be used along with informal or anecdotal measures to help evaluate the success of GIS applications. To develop more quantitative metrics, organizations might consider looking at user statistics, such as the number of “hits” or downloads applications have received, or the number and content of user feedback and comments. Qualitative measures or criteria could examine users' perceptions of the application and its benefits. Whether focused on qualitative or quantitative data, organizations formalize measures and criteria by creating documentation (e.g., a memo or report) to outline their use and can conduct evaluations on regularly scheduled basis, rather than ad hoc.
- The objectives of a GIS application typically lead to determinations about the type of data model that should be used in a given application. Developers of an application that focuses on consensus building and highlighting connections might use a model that allows users to input their own data. An application that focuses primarily on decision-making might instead use a model that includes pre-loaded data. Furthermore, use of open data, whereby spatial information is made readily available to any interested individual, is an important component of many GIS tools for livability. Prior to creating a GIS tool for livability, organizations might assess whether open data are available; organizations might also consider making their own datasets available to the public to support broader development of GIS tools for livability.
- Creating GIS tools for livability leads to many benefits and does not need to be a challenging process. To minimize technical difficulties that might arise, organizations might consider early on what resources are available to purchase data, if necessary, or where data can be obtained (including open data). Additionally, prior to developing GIS tools, organizations should carefully think through how data will be organized, sorted, displayed, and shared.
CASE STUDIES
This section presents in-depth case studies with interviewed organizations. Each case study includes background on the organization's need for the GIS tool, information on how the tool was developed, challenges and benefits encountered while utilizing it, and examples of how users and other organizations have applied the tool.
MULTIMODAL CORRIDORS: THE CITY OF BOULDER (COLORADO) TRANSPORTATION DIVISION’S TRANSPORTATION MASTER PLAN GIS CORRIDOR ANALYSIS AND MAP IT APPLICATION
Background
The City of Boulder, Colorado's Transportation Division is responsible for addressing the safe, efficient, environmentally sound, and balanced movement of people and goods, as well as maintaining and managing the multimodal transportation system.18
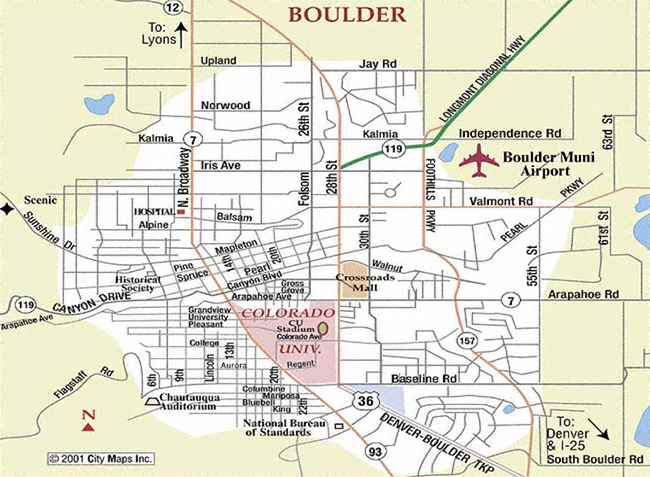
Figure 1. Map of Boulder, Colorado.19 The City of Boulder is located in north-central CO and has a population of about 103,000.20
Boulder's work to support quality of life, smart growth, environmental preservation, and other livability-related concepts predates the USDOT, EPA, and HUD Partnership for Sustainable Communities and its articulation of six livability principles. For example, in 1967, Boulder voters approved a sales tax to purchase and maintain open space, the first instance of a U.S. city approving a tax specifically for open space. Other notable past efforts supporting transportation livability have included:
- In 1978, the Boulder Valley Comprehensive Plan established an important framework for growth management by outlining an urban growth boundary to preserve rural lands, manage growth, and better integrate land use and infrastructure planning.21
- In the 1980s, the city developed the Boulder Creek path, a multimodal, grade-separated four-mile trail designed to address transportation, habitat restoration, and flood management concerns. The pathway attracted widespread positive attention and led to development of the Boulder Greenway System, a network of trails in the city.
- The city adopted its first Transportation Master Plan (TMP) in 1989 based on recommendations from a citizen study committee. The TMP established a goal of a 15 percent modal shift from automobile to bicycle, transit, and pedestrian traffic to address concerns with growing traffic.
- Go Boulder, a program developed as a result of the 1989 TMP, supports increasing travel options available to the community and specifically a goal of no long-term growth in auto traffic.22 The program has initiated business and neighborhood transit pass programs, numerous high-frequency transit lines, a comprehensive network of bicycle and pedestrian trails, and other amenities such as real-time transit schedules.
More recently, in 2007 the city developed GOBikeBoulder, a website that allows users to plan customized bicycle routes along more than 300 miles of bike lanes and paths in Boulder.23 The application supports providing information to transportation users that allows them to make better decisions, particularly regarding modal choices. The application also offers features that address the health and economic aspects of livability. For example, one feature estimates the number of calories expended to bike a particular route. Another feature estimates the number of gas dollars saved by bicycling instead of driving a car along the intended route. Users can also specify amenities (e.g., grocery stores) that they would like to include in their chosen route (see Figure 2).
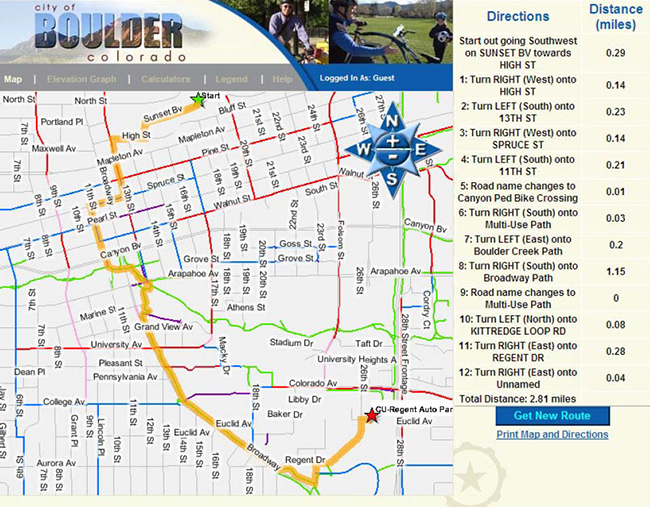
Figure 2. Screenshot of GOBikeBoulder with preferences of “on street” routing and “bike parking” along the chosen route. The route is highlighted in orange.
Boulder's 1996 Transportation Master Plan (TMP) identified ten multimodal corridors but did not identify which were priorities for transportation investment. According to the Transportation Division, multimodal corridors are considered the major transportation facilities that carry a majority of traffic, connect important activity centers, and provide access to the regional transportation system.24
As part of its 2003 TMP, Boulder's Transportation Division analyzed these 10 corridors and divided them into 42 corridor segments based on similar characteristics. Proposed transportation improvements, which were previously recorded on paper maps, were digitized and related to a corridor segment in a GIS-compatible format. In converting these data to GIS, the 2003 TMP plan was able to promote a more strategic approach to directing major transportation funding to a prioritized set of multimodal corridors. Since the 2003 TMP, this framework has provided the basic investment framework for transportation budgets.25
The effort had three primary livability-related objectives:
- Identify factors that make a successful “multimodal” corridor.
- Ensure that improvements in the corridors address all modes and their interaction with the overall transportation system.
- Help the city strategically invest in multimodal corridors that have or anticipate significant growth and mixed-use development.
The effort also aimed to support other broader 2003 TMP goals related to livability. These goals included achieving no growth from 1994 levels in long-term traffic volumes by 2025, expanding transportation alternatives for all residents, and targeting investment to support mixed-use development and continued quality of life.26
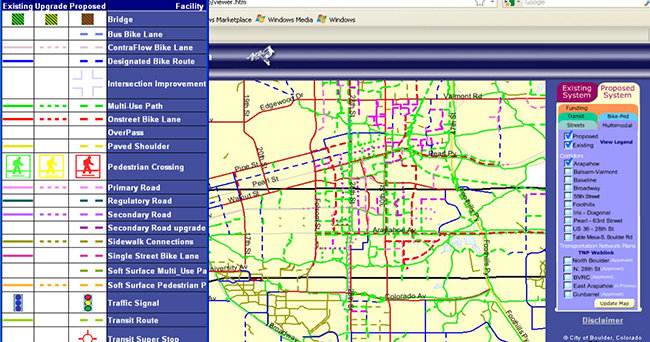
As part of the work to GIS-enable the 2003 TMP, the city also created an ESRI ArcIMS-based “Map It” application using data from the plan.27 The application allows public users to visually explore the existing and planned transportation system, including projects within multimodal corridors (see Figure 3).
Boulder's Randall Rutsch, Senior Transportation Planner in the Transportation Division, believes that the Federal definition of livability is a broad term might not fully capture all livability-related efforts. While both Map It and Boulder's GIS conversion of multimodal corridors support livability goals, the Transportation Division has not explicitly framed these efforts as livability initiatives. The livability goals that Map It and the GIS corridor analyses have supported included developing “complete streets,” providing information on transportation options, sustaining investments in walkable neighborhoods through multimodal corridors, and using corridors to enhance the city's overall character and quality of life.
Map It Development
Map It was launched in November 2003 after approximately one year of development. It was designed to be user-friendly and make transportation planning and project information broadly accessible and usable to a non-technical audience. For example, all Map It projects are named, classified by type, and include geo-locators to support users' abilities to search and find projects of interest. The application includes information on all existing and planned transportation projects, including roadway, pedestrian, bicycle, and transit improvements. One practical aim was to assist city planners and developers to see how and where planned transportation improvements might interact and anticipate potential right-of-way needs or obligations.
Map It was initially developed from project descriptions and graphic images included in the 1996 TMP. This information was then digitized into a GIS format with assistance from a consultant. Additional projects and detail were added in the 2003 effort in an effort to develop complete systems for all modes of travel. Over 800 projects were added to Map It, half of which were identified from the 1996 TMP.
GIS Corridor Analysis Methodology
Two full-time staff in the city's Transportation and GIS Divisions managed the GIS analysis for the 2003 TMP, which required a multi-step process.29 Staff also worked with a consultant team to assess a variety of corridor conditions related to land use, travel, and pedestrian conditions. The consultants also conducted traditional transportation modeling as part of the planning effort.
First, staff divided the 1996 TMP corridors into 42 segments. These segments provided a basis for assessing corridors' unique characteristics and travel behaviors.
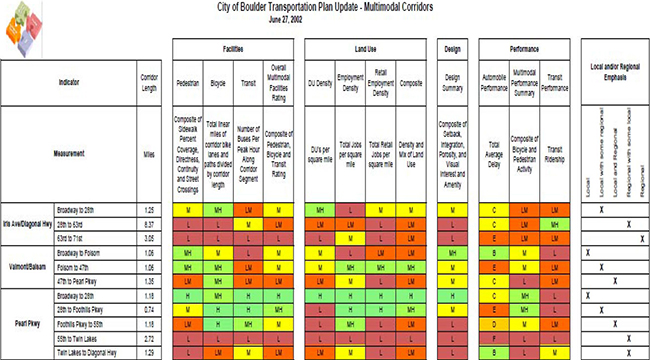
Staff then compiled and analyzed quantitative and qualitative data for each segment (see Figure 4). Quantitative GIS data included the number of pedestrian street crossings, extent of sidewalk connectivity, number of buses per peak hour, and transit ridership within each corridor. These data were obtained from several sources, including previous plans, community surveys, travel diaries, and GIS analyses of existing data layers such as land use and building size. An effort was made to collect information on all facilities and land uses within a quarter-mile of each corridor.
To obtain qualitative data on the 42 segments, city staff asked stakeholders to walk, drive, or bicycle along each corridor and evaluate its “feel.” These stakeholders included members of the TMP taskforce, a group of over 30 community members representing a cross-section of the community as well as members from the Transportation Advisory Board. Other interested bike and pedestrian users were recruited to help evaluate the corridor segments.
The intent was to gather information on what makes a corridor generally conducive for walking or bicycling. Finally, with quantitative and qualitative data collected and added to the GIS, the project team devised a scheme to identify priority corridor segments. Categories in the scheme included the extent of corridor congestion, safety upgrades needed, and whether the corridor was a key regional transit route. Corridors considered “successful” were assessed to identify lessons learned. For example, the Broadway corridor was identified as the most successful multimodal corridor. It has complete bicycle and pedestrian facilities, high-frequency transit service supported by two major employment destinations (a university and the downtown area) with managed (i.e., paid) parking, and strong transportation demand management programs. This combination of factors supports a high alternative-mode share although the majority of the corridor is characterized as a suburban residential area.
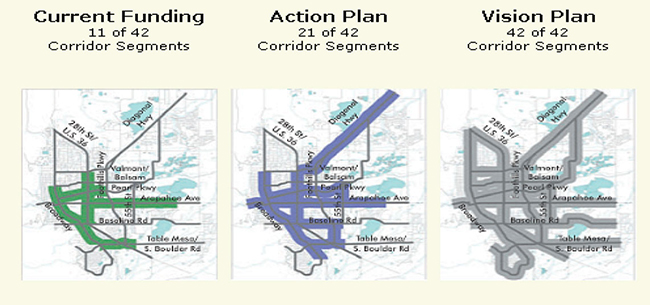
Finally, once corridor segments were analyzed, the segments were utilized to prioritize different investment scenarios (see Figure 5). Currently available funding allowed improvements in 11 of the 42 segments to be built. Additional funding identified for the action plan would allow improvements in 21 of 42 segments to be built while the funding identified in the vision plan would allow improvements to be completed in all segments.
Outcomes and Next Steps
The GIS corridor analysis allowed staff to comprehensively identify the factors that comprised a successful multimodal corridor. Staff believe that a “successful” multimodal corridor is one that is complete for all modes to provide a range of transportation choices for users, has supportive land uses, and exhibits a high level of alternative-mode use. While Transportation Division staff believe that Broadway is currently the best example of a successful multimodal corridor, staff also anticipate that planned improvements in other corridors will support similar modal shifts.
The corridor analysis also helped staff make better connections between land use and transportation, such as to identify why a high-frequency transit service focused on an industrial park had failed. The analysis showed that several factors minimized the incentive to use the service, including low density and ample free parking along the transit corridor, the limited range of its land uses, and the presence of large parking lots that had to be crossed to access the service.
The city has not needed to update data on travel characteristics and other components of the corridor analysis, although information on projects is regularly updated and added to Map It. In addition to developing comprehensive plans and master plans, the city has also completed more focused plans for areas of the community that are anticipated to change significantly.32 When such plans are adopted, they are used to amend the TMP so that Map It displays the most current vision of planned transportation improvements.
Next steps for Map It will include adding information on each investment program to the planned improvements. While all existing and planned transportation projects are currently displayed in Map It to allow for right-of-way preservation, adding information on priority projects—as represented by the investment programs—would help provide more information to the public. Additionally, the city might link Map It to social networking applications, such as Facebook, to further its ability to engage the public. Map It currently runs on a legacy ArcIMS software; Transportation Division staff might consider updating the software in the future or building a web-based version of Map It that would allow any staff to update or add information (currently, any updates must be routed through one staff person).
Livability-Related Benefits and Challenges
The Transportation Division experienced few challenges when developing the GIS analysis and Map It. The city noted that complete streets are very integrated as part of its overall transportation policy and there is widespread support for efforts or investments that follow these principles. However, the city noted that developing the multimodal corridor GIS and Map It required a large amount of time and effort due to the large number of projects that were included. It was also difficult to determine the best way to organize and store the information in the GIS analysis. Developing a standardized schema for naming features in Map It was another challenge. A key success factor for the GIS analysis was having support from the city council.
Boulder's Transportation Division has not conducted a formal evaluation or assessment of the GIS corridor analysis or Map It, although statistics are occasionally collected on the number of online “hits” Map It has received. Staff has also received good feedback on Map It on an anecdotal basis. The Transportation Division believed that both the corridor analysis and Map It efforts had been very effective for several reasons:
- The corridor analysis has:
- Allowed staff to identify what makes a successful multimodal corridor and a complete street in terms of travel behavior, functionality, and mode share.
- Helped the city to assess its investment priorities within the 42 corridor segments and bolster policy commitments to livability-related concepts, including managed growth, travel demand management, and complete streets.
- Map It has:
- Made transportation information more accessible to a broader audience via a web-based application.
- Helped residents become more informed about transportation projects in their neighborhoods.
- Allowed Transportation Division staff to communicate more effectively with residents about planned projects, thereby supporting community engagement in transportation issues as well as a broader transportation dialogue.
- Facilitated Transportation Division staff's ability to plan future projects and communicate more effectively with developers.
LOCATION MATTERS: THE CENTER FOR NEIGHBORHOOD TECHNOLOGY’S (CNT) HOUSING AND TRANSPORTATION AFFORDABILITY INDEX
Background
The Center for Neighborhood Technology (CNT)33 is a multi-disciplinary think tank that promotes urban sustainability. CNT has conducted research to quantify the extent to which urban form contributes to livability. In CNT's view, regions or municipalities are considered more livable if people can walk, bicycle, or ride transit to access their destinations and rely less on motorized vehicles.
CNT, along with other researchers, formulated the concept of “location efficiency” to help promote economically diverse and livable places. This concept, which aligns with the HUD, USEPA, and USDOT livability principles and is one of the primary components of CNT's idea of livability, is based on the idea that a place has an inherent value that stems from that area's development patterns. Compact neighborhoods that have walkable streets, access to transit and jobs, a wide variety of stores and services, and a reduced dependence on cars and trucks have higher location efficiencies than neighborhoods without these amenities.
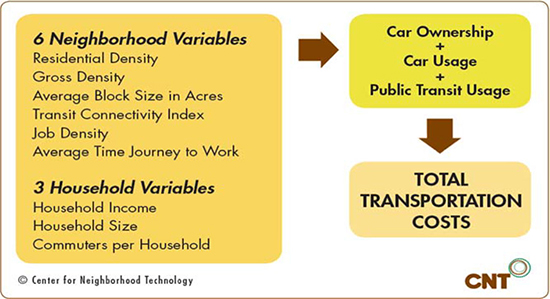
Partnering with the Center for Transit Oriented Development, CNT developed a tool to make the location efficiency concept more tangible and allow users to visualize the impact of travel costs on their neighborhood's affordability. The tool, known as the Housing + Transportation Affordability (H + T) Index,34 provides a more complete understanding of housing affordability by factoring in both housing and transportation costs in a neighborhood. It also offers a more comprehensive idea of how a neighborhood fits a person's budget by dividing housing and transportation costs by representative regional incomes. Traditionally, housing has been deemed “affordable” when it consumes no more than 30 percent of income. Taking a different view, the H + T Index defines a neighborhood “affordable” if its combined costs of housing and transportation amount to no more than 45 percent of income. When the tool was first released in January 2006 for the St. Paul/Minneapolis, Minnesota, area, researchers concluded that automobile ownership and use and transit ridership depend on and are driven by residential density and household income.35
Since these and other H + T variables are intrinsically geographic in nature, GIS is a critical component in developing the Index. For example, using GIS, CNT employs Census Transportation Planning Package (CTPP) data in the H & T Index using a geographic measure of the regional jobs weighted by proximity. These data allow analysis of employment opportunity and intensity, which is a critical component of the household transportation cost model. CNT used the SPSS statistical package, to develop the model once the geospatial components were assembled using the MapInfo Professional GIS geographic analysis application.
GIS continues to play an important role in displaying the Index's results. In 2008, CNT expanded the H + T to include neighborhood-level data for 52 U.S. metropolitan areas and needed to quickly and clearly display these data to users. In response, CNT used MapServer,36 an open source platform for publishing online spatial data to create an interactive mapping website that presents H + T results at the neighborhood level. The interactive mapping website also provides additional information, in both map format and tables, on vehicle ownership, transit use, housing density and other community characteristics.
CNT decided to use the open source platform, which resides on a LINUX server and utilizes an open source SQL relational database (PostgreSQL) with a geospatial extension (PostGIS), open source web mapping utility (MapServer) and open source programming language (PHP), because of the flexibly of implementation and, secondarily, as a cost savings mechanism. With limited financing and eight GIS analysts on staff, CNT believes that GIS is a concept and not a product. It focuses using a variety of geospatial tools as the licensing costs for one specific software could make some geographic analyses impractical. CNT's Geographic Research and Information Department uses several implementations of GIS, including MapInfo Professional, ArcGIS from ESRI, as well as the open source tools listed above, and the open source desktop GIS program Quantum GIS.
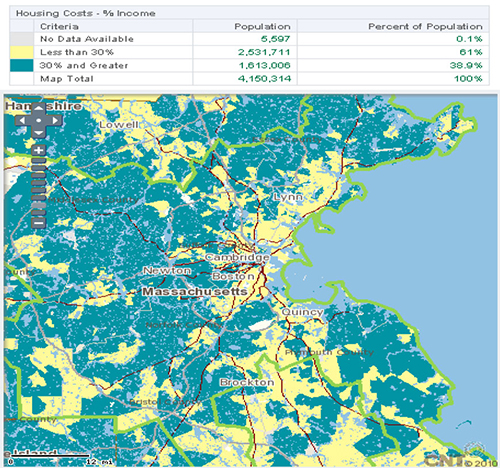
Figure 6. Screenshot from the H + T Affordability Index.
Uses of the H + T
Jurisdictions are using H + T in a variety of ways. In one example, the Chicago Metropolitan Agency for Planning (CMAP) is using H + T data to evaluate scenarios and guide development of GO TO 2040, the region's long-range transportation plan. CNT has completed a customized H + T analysis for CMAP. In another case, the Metropolitan Transportation Commission in San Francisco adopted a housing/transportation goal in its long-range transportation plan, and commissioned an H + T analysis from CNT to produce baseline data and analysis of priority development areas. In Washington, D.C., CNT fine-tuned the model for the Washington DC Office of Planning by adding land use data and the City's transit network analysis, and is creating a scenario planning tool.38 Other agencies that have used H + T data and outputs in developing their policies and plans include the Southern California Association of Governments and the City of El Paso, Texas, which was the first municipality to develop an ordinance based on H + T analysis.39
CNT has also used the H + T Affordability Index to power other spatial applications for non-technical audiences. For example, Abogo40 is a consumer tool that measures the money that an average household living in a particular neighborhood in a given region might spend on transportation, including car ownership, car use, and transit use. Abogo also translates the calculated level of car use into a volume of carbon dioxide generated, further refining the true cost and impact of residence choice.
CNT noted that a good use of H + T output data would be to support efforts to locate people in more transportation-efficient locations (via, for example, revised zoning regulations that encourage TODs).
Success and the Future
CNT released the latest version of H + T in March 2010. It expanded the area of analysis to cover 337 American metropolitan areas, providing coverage for more than 80 percent of the Nation's population. With a grant already in place to continue the enhancement of the H + T, CNT anticipates the availability of the latest Block Group data from the 2010 Census and the 2005-2009 ACS 5-Year Estimates. That information will be used to update H + T and expand its geographic coverage to all metropolitan and micropolitan areas in the United States, encompassing roughly 95% of the US population.
CNT has not devised any formal metrics to assess the past success of H + T, but does use Google Analytics web use tool to track usage. Although the continuing availability of grant funding suggests that the tool provides data that help evaluate and promote sustainable, livable communities. CNT attempts to track H + T's online use. Users can register on the website for CNT's email and monthly newsletter lists. Both lists continue to grow, indicating that interest in the application is also increasing. Feedback on improvements to the tool and user interface is also collected, as CNT noted that it would like to find the best balance possible between providing geographic and verbal/text information.
Other transportation- and livability-related GIS applications
In addition to the H & T Index, CNT has developed other applications to advance the state of livability practice in communities nationwide. Recently, CNT, in partnership with the Federal Transit Administration, created a TOD database (https://toddata.cnt.org/) that aggregates 40,000 data points for the half- and quarter-mile buffers for over 4,100 fixed rail stations across the country. The application is unique in using GIS to combine a variety of datasets within a buffered area to compare economic and demographic information at all existing and proposed fixed guideway transit stations.
With funding from the US Green Building Council, CNT also developed the Transportation Energy Intensity calculator, a beta-phase tool that explores the transportation energy use that specific buildings necessitate (see Figure 8).41 The calculator demonstrates that the same building placed in different locations creates different transportation energy demands and impacts. CNT expects to continue to revise the tool to better measure and model site comparisons.
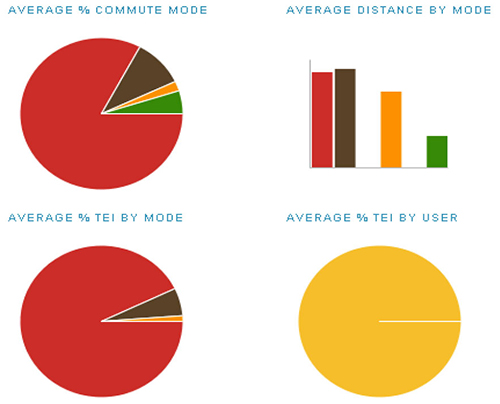
Figure 8. Example output from the Transportation Energy Intensity Calculator.
PARTICIPATORY GIS: OREGON TRANSPORTATION RESEARCH AND EDUCATION CONSORTIUM (OTREC) AND UNIVERSITY OF OREGON’S ACTIVE TRANSPORTATION PLANNING APPLICATIONS
Introduction
Since 2003, University of Oregon professor Marc Schlossberg has been working to develop a series of mobile GIS tools to assist with mapping a neighborhood's conduciveness to biking and walking. With initial funding from the Oregon Transportation Research and Education Consortium (OTREC) and the National Center for Biking and Walking (NCBW), Schlossberg and a team of students and associates designed the tools with the intention that they would be a resource for the general public to assist with mapping the characteristics of a neighborhood's streets, sidewalks, and intersections. The “participatory GIS” concept aims to help cities and towns better understand what makes a good walking or biking environment from the perspective of its residents. By enabling citizens to participate in collecting data directly from the field, the “participatory GIS” method engages community members and raises awareness of conditions in the built environment that contribute to biking and walking safety. This case study focuses on two projects and reports completed by Marc Schlossberg, Nico Larco, and the University of Oregon: “Active Transportation, Neighborhood Planning and Participatory GIS (Geographic Information Systems)”42 (2008) and “Transferring Community-Based, Active Transportation GIS Assessment Tools Nationwide” (2009).43
Background
Schlossberg's interest in participatory GIS matured before the U.S. DOT declared “livability” as an official initiative. His research has focused on topics like safety, convenience, social equity, social capital, housing equity, and housing choice, as they relate to good walking and biking environments. Schlossberg believes these topics embody the meaning of livability but does not necessarily believe that there is only one definition of livability.
The early stages of this work began as a result of a class on participatory GIS that Schlossberg taught at the university in 2003. The class, which was funded by a small grant, placed little emphasis on transportation. In promoting his concept of participatory GIS, Schlossberg aimed to help cities and towns better understand what makes a good walking or biking environment from the perspective of its citizens. In the first phase of the project, the only phase that has been funded to date, the effort focused on “develop[ing] and test[ing] a series of GIS-based active transportation assessment tools that can be utilized in a public involvement forum where data gathering, data synthesizing, and basic map production can be carried out with minimal training and minimal need for an outside technician.”44
Schlossberg recognized that similar tools had been developed elsewhere, but none focused on data collection by citizens. For example, the PEDS (Pedestrian Environment Data Scan) tool45 was developed to measure environmental features that relate to walking in varied environments in the United States. PEDS relied on the collection of data in the field, but the collection process was performed by transportation/GIS professionals rather than untrained volunteers. At the time, the PEDS tool was one of the only applications available that included neighborhood-scale walking and pedestrian data. Continuing in a similar conceptual direction, Schlossberg chose to place more emphasis on the average citizen's ability to collect data, thus making them more aware of the many variables that contribute to walkable/bikeable streets. Once collected, Schlossberg believed that the data could be transferred to another entity (e.g., municipality, community group) to display and/or analyze the information using a more traditional desktop GIS platform.
When OTREC became aware of Schlossberg's work, it offered to fund development for a project applied specifically to neighborhood transportation. Another partner, NCBW, provided additional funding support. NCBW's primary interest was in testing and implementing the tool in communities around the country. No clear funding stream has been identified for future project phases.
Software Development, Management, and Maintenance
As a result of the first phase of the mobile GIS project, four tools were developed:
- School Environment Assessment Tool (SEAT) – Intended to support the national Safe Routes to School Initiative;
- Complete Streets Assessment Tool (CSAT) – Intended to serve as an audit tool in support of “Complete Streets;”
- Accessibility Audit Tool (AAT) – Focused on issues connected to accessibility and the Americans with Disabilities Act; and
- BASIT – Focused on bicycling environment and route identification.
All four tools rely on citizen input and Schlossberg's concept of participatory GIS. Based on their depth of development, however, SEAT and CSAT were considered the best tools to introduce to communities for implementation. CSAT and SEAT typically focus on small geographic areas, but the scale ultimately depends on the number of volunteers willing to participate in the one-day data collection exercise.
To develop CSAT and SEAT, the development team used Census TIGER line data to create basemaps that were installed on handheld computer devices. The devices ran ArcPad, an ESRI product designed for handheld devices. Data gathered in the field could be added to provide context to the base TIGER data, including discrete or quantitative information such as sidewalk width, curb cuts, and street trees, as well as qualitative information pertaining to environmental surroundings and sense of safety. The project team valued the tools' ability to combine both objective and subjective (quantitative and qualitative) data for the street segments and intersections of a neighborhood.
Each tool's interface was developed in a format that posed questions to users about the environment. The team found that the sequence of questions was critical; examples of CSAT's interface and questions are shown in Figure 9 below.
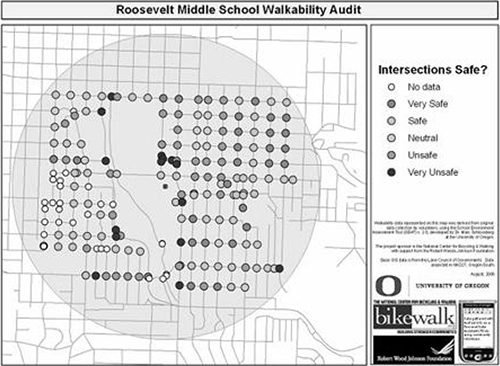
To gather new data in a consistent manner, Schlossberg and his team ensured that the basemap was simple and straightforward, emphasizing street segments and intersections while avoiding extraneous information that might have affected a data gatherer's perception of the environment. In addition to answering questions, users could add data points to the map indicating hazards and obstructions (see Figure 10).
Schlossberg and his team faced few major obstacles during the tool's back-end development. One minor challenge involved creating intersection data within the basemap, as this information was not part of the TIGER dataset. On the whole, however, university resources and computer programming specialists on the project team allowed Schlossberg to work through many of the technical challenges encountered during the tool's development.
More significant obstacles, however, arose with the tools' distribution since the supporting technologies are constantly evolving. According to Schlossberg, it was difficult to distribute an ArcPad program because very few agencies or communities own the software. Furthermore, the software can be unstable and the handheld devices that support ArcPad are continually being upgraded. It has also been difficult for the project team to keep up with software and hardware upgrades. At one point, the project purchased 50 data collection devices that worked using personal digital assistants (PDAs). Shortly thereafter, the software was updated to a new version that was not supported by the purchased device. For a short period of time, the devices continued to function for data collection, but later become obsolete and are not currently being used.
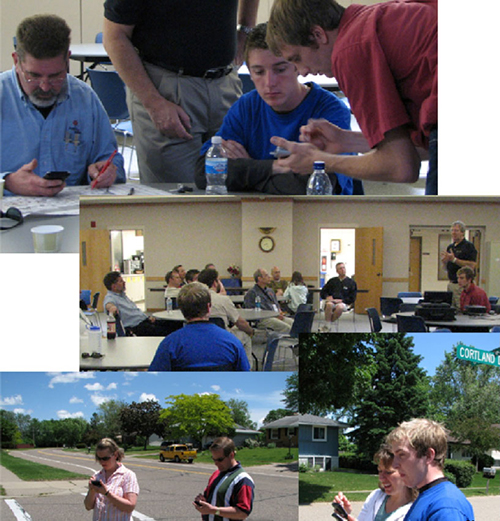
Both the SEAT tool and the CSAT tool have undergone pilot testing in a number of communities around the country. Based on the amount of documentation in OTREC reports, the SEAT tool was successfully tested at Roosevelt Middle School in Eugene, Oregon, while CSAT experienced some success in Silver Spring, Maryland; Apple Valley, Minnesota; and Martinsville, Virginia.
The pilot testing workshops showed participatory mapping tools to be useful in assessing the transportation environment of a neighborhood, though they might be considered expensive at a cost of approximately $38,000 – $52,000 needed for a single, six-hour community workshop.48 In the Oregon case, much of the cost was subsidized through OTREC, the Active Living Resource Center, and the NCBW.
A basic breakdown of the approximate cost for each community workshop49 is outlined below:
- Hardware requirements: 20-30 PDAs.
Community cost: $10,000 - Software requirements: ArcPad and ArcPad Application Builder; ArcGIS.
Community cost: $17,000 - Obtaining base GIS data.
Community cost: $0 - Customization of the tool at community request.
Community request: $3,000 – $15,000 - Site travel (workshop must be facilitated).
Community cost: $5,000 – $15,000 - Correspondence with client: pre-workshop planning, data processing, map preparation.
Community cost: $3,000 – $15,000
Evaluation
Formally, the project team had no official system of metrics, though more informal evaluations did occur. At an internal level, Schlossberg and his team focused on the evolution of the tool, testing iterations in the field and discussing what worked and what did not. Externally, the team received helpful insights from users in the field, such as “this question made sense to me, but this one did not.”
Some of the most useful feedback generated from the participatory GIS tool has come from the volunteers who participated in data-gathering exercises, particularly from those who were previously unfamiliar with many of the environmental problems associated with active transportation.
Benefits and Lessons Learned
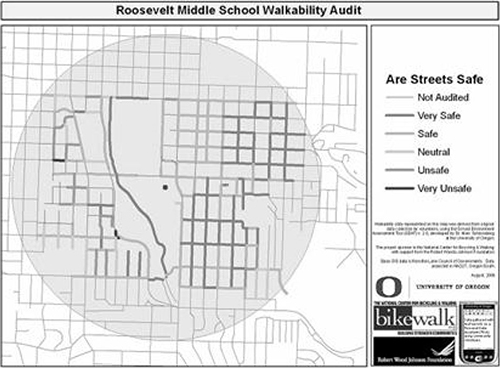
Schlossberg feels that the implementation of the SEAT tool at Roosevelt Middle School in Eugene, Oregon, illustrates the potential for participatory GIS as a method for gathering useful data while empowering neighborhood residents. The school recruited volunteers to gather street and intersection data as part of the audit process for the Safe Routes to School program. The school then used the data to secure funding in 2005 for safety improvements through Safe Routes to School. Five years later, much of the original data are still being used.
Schlossberg reported that significant benefits have been seen from the tool's implementation efforts in Virginia, Maryland, and Minnesota. These benefits stem from the tool's ability to engage citizens in a subject matter that affects the environment in which they live. Many of the volunteers who participated in the data-gathering exercises were aware of what they wanted with regard to active transportation, but were unaware of the factors in the built environment that detracted from the desired outcome. The concept of participatory GIS helped to raise awareness, while empowering volunteers to develop a GIS database seen as essential for justifying municipal-level improvements to neighborhood infrastructure.
TRANSIT ORIENTED DEVELOPMENT AND SCENARIO PLANNING: THE SOUTHERN CALIFORNIA ASSOCIATION OF GOVERNMENTS' (SCAG) CALIFORNIA LAND OPPORTUNITIES TRACKING SYSTEM (CALOTS) AND LOCAL SUSTAINABILITY TOOL
Background
The Southern California Association of Governments (SCAG) is the nation's largest metropolitan planning organization (MPO). It serves a population of 19 million in six counties and 190 cities, including Los Angeles (see Figure 12).
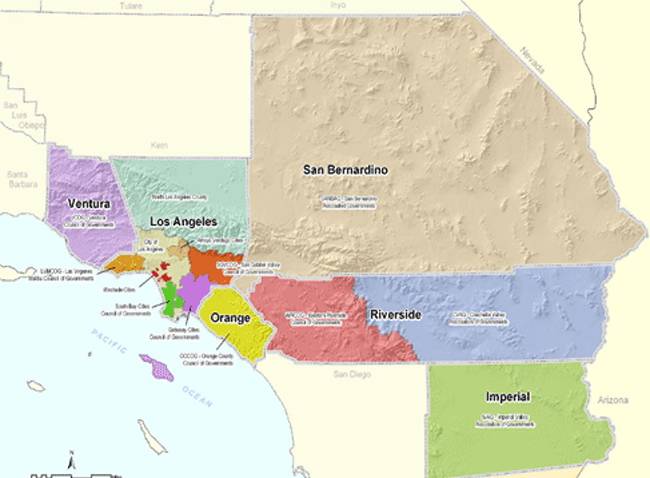
Figure 12. SCAG region.
SCAG is currently using two GIS-based tools, the California Land Opportunities Tracking System (CA LOTS) and the local sustainability planning tool, to support several statewide and regional livability-related initiatives, including the development of Sustainable Communities Strategy (SCS) to meet California Senate Bill (SB) 375 requirements; and the analysis of growth opportunity areas in the SCAG Compass Blueprint program:
The SCS Initiative began in January 2009, when California passed state SB 375.51 The bill aims to reduce GHG emissions from passenger vehicle miles traveled (VMT) by promoting compact development, sustainable transportation, and housing choices. SB 375 requires all of California's 18 MPOs develop SCSs that plan for reducing GHG emissions to meet targets developed by the California Air Resources Board. It also requires regular (approximately every four to five years) SCS updates as part of each MPO's transportation plan.
To develop its SCS, SCAG will conduct a series of scenario planning workshops throughout the region beginning in 2011.52 The purposes of the workshops are to convene public stakeholders and use their input to develop a regional land use and transportation strategy based on cost-effective land use and policy strategies.
In parallel, as part of the Compass Blueprint53 program, SCAG developed a regional growth and land use vision in collaboration with diverse stakeholders across the region. The vision plan, which was finalized in 2004, identified “strategic growth opportunity” areas, or “2% areas,” which represent two percent of the land area in SCAG's region. Examples include locations with existing or planned rail transit stops that are near existing or projected employment/residential centers.
CA LOTS
CA LOTS is a region-wide, web-based information portal and mapping platform designed to support and promote TODs. Elected officials, city planners, real estate developers, and community organizers are the tool's primary users. Most of the application is accessible to the public; however, there are some password-protected parts due to contractual agreements with data providers (e.g., certain parcel-level data fields).
Overall, CA LOTS aims to help assess and maximize the potential for infill development in the 2% areas that include existing or projected employment centers and transportation (particularly transit) infrastructure, such as light rail, heavy rail, and commuter rail stations.
CA LOTS runs on ColdFusion 7, ESRI's ArcIMS 9, and SQL Server 2000. It contains multiple datasets related to density, build capacity, infill estimation, transportation/travel characteristics, and mode choice. The tool allows users to create customized GIS maps for specific neighborhoods, view associated demographic data, and analyze development potential in diameters of ¼-mile, ½-mile, and one mile around transit stations (see Figure 13). Users can also access a “drive-through” function to view a specific parcel or street scene.
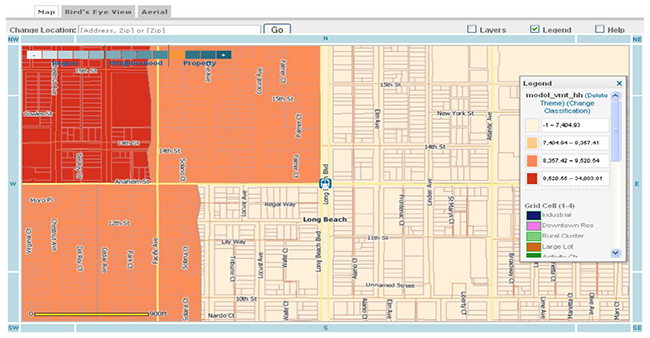
Figure 13. Example of CA LOTS map: VMT per household per transportation analysis zone.
Local sustainability planning tool
The local sustainability planning tool was designed for use by SCAG's local jurisdictions when conducting SCS scenario planning workshops. It allows local governments and stakeholders to create various development scenarios, assess their impact on various livability-related indicators, including VMT, and view their effect on GHG emissions. During the workshops, users will review pre-programmed base scenarios and construct alternatives; the tool will provide real-time feedback on impacts (see Figure 14 and 15). Overall, the tool aims to increase understanding of how to reduce GHG emissions and achieve emission targets while supporting stakeholders in their effort to create a collective land use and planning regional vision.
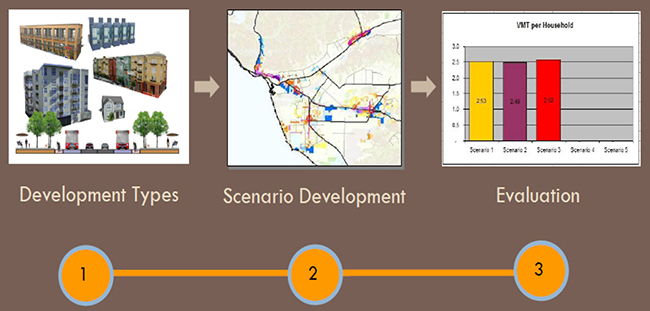
Figure 14. Local sustainability planning tool process.
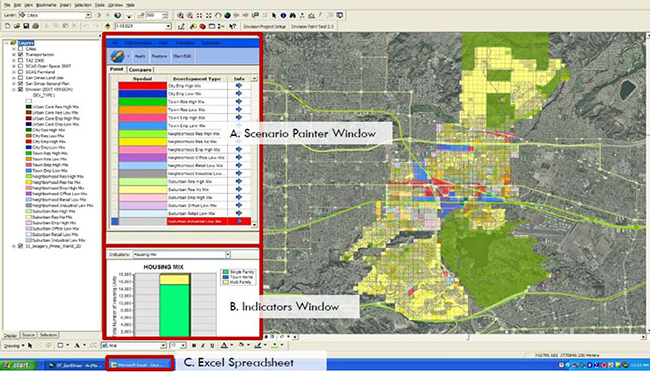
Figure 15. Local sustainability planning tool interface.
Support of Livability
CA LOTS and the local sustainability planning tool support the SCS and the Compass Blueprint program by providing data for the SCS scenario planning workshops and facilitating assessment of Compass Blueprint's 2% areas and other TOD analyses. In doing so, the tools make a number of livability connections in the following areas:
- Users can more easily access data related to transit, infill development, and GHG emissions and make better decisions about smart growth, TOD, and air quality planning/project development.
- Users can make modal and land use choices by helping to quantify and visualize the potential impacts of these decisions.
- Users can provide input into how communities should look, “feel,” and function, thus supporting overall community revitalization and development.
Development and Management
CA LOTS
CA LOTS was first conceived as part of a study on interregional partnerships for job and housing balance funded in part by the State Housing and Community Development Department (HCD). Using funding from the HCD, SCAG developed a CA LOTS prototype, known as LA LOTS, which was designed to better connect transportation to interregional job opportunities and included data on Los Angeles transit stations, which comprise about half of all transit stations in the SCAG region.
With funding support from the SCAG Compass Blueprint program, SCAG expanded LA LOTS' coverage to include the entire six-county region (Los Angeles, Ventura, Orange, Riverside, San Bernardino and Imperial Counties). The University of California-Los Angeles' (UCLA) Center for Neighborhood Knowledge (CNK) provided substantial support for the design, development, and upgrading of the LA LOTS web portal.54 The effort evolved to CA LOTS and was part of a larger project to develop web-based GIS tools for monitoring and promoting TOD. SCAG research had illuminated significant job sprawl in the region and the agency wanted a tool to help direct employment centers to transit districts.
CA LOTS includes several livability-related data layers at the regional and neighborhood scale, including datasets from CNT's H + T Index55 and the CTPP. Other livability-related layers include data on economic issues (e.g., employment by industry), land use, and transportation (e.g., rapid bus lines and stops, metro lines and stops).
Data for CA LOTS were obtained in several phases, starting with U.S. Census data and aerial photography. Additional layers were added as the tool's GIS capabilities increased. The most recent tool update included adding CNT's Housing and Transportation Affordability Index. Additionally, SCAG and ULCA's CNK are now adding 2008 data from the U.S. Department of Housing and Urban Development to update relevant layers. SCAG plans to incorporate additional datasets as they became important to the communities that SCAG serves, while maintaining a transit focus.
In the future, SCAG plans to make the CA LOTS interface more user-friendly to take advantage of new technologies and provide information more quickly.
SCAG has promoted CA LOTS at numerous events, including conferences, meetings, and workshops. For example, SCAG has attended the Transportation Research Board Tools of the Trade Conference in September 2010 and the Partners for Smart Growth annual conference in 2006. SCAG and UCLA-CNK also conducted training sessions or presentations on CA LOTS for the American Planning Association, the Los Angeles County Public Landowners Assistance Network, the mayor of Los Angeles, and others. SCAG also held a major evaluation session at Caltrans to demonstrate the tool and discuss potential improvements. SCAG promotes CA LOTS on its Compass Blueprint website and uses the CA LOTS' website to assess the number of users.
CA LOTS cost approximately $500,000 to develop. The majority of this funding was provided through grants from Caltrans, the California HCD, and the SCAG Compass Blueprint program. UCLA contributed matching funds and also hosts the CA LOTS tool on its server.
Local sustainability planning tool
SCAG's Comprehensive Planning Department manages the local sustainability planning tool, which was funded through Compass Blueprint and Caltrans' grants.
The tool uses ArcGIS 9.3 desktop software and was developed by integrating two separate modules: (1) a scenario planning module built using Envision Tomorrow56 software that portrays different development types; and (2) a transportation impact module that assesses how different development types “perform” in terms of vehicle ownership, VMT, trips by mode, and GHG emissions. The development types represent a mix and intensity of development, such as “suburban residential” or “city employment,” and allow analysis at a 5.5-acre grid cell level. The cost to develop and integrate the transportation impact module was $100,000.57
Livability-related data in the local sustainability planning tool include socio-demographics (e.g., household type), local land use characteristics (e.g., density), and transportation (e.g., travel mode split, regional accessibility, modal access, alternative modes). Parcel-level land use data are updated every two to three years and other data layers are updated every four years according to SCAG's planning cycle. Other data layers are updated every four years according to SCAG's planning cycle.
SCAG first piloted the local sustainability planning tool in March 2010 with local jurisdictions. After integrating users' feedback, SCAG expects to release a web-based version of the tool in 2011.
Challenges
SCAG noted several challenges related to obtaining data for CA LOTS. For example, parcel-based information was expensive to purchase during the early years of the project's development. This information is now typically available to the public for free. To address this challenge, SCAG focused on leveraging its resources by partnering with universities, other transportation agencies, and the private sector.
Another challenge was determining the appropriate scale for displaying data, as well as integrating datasets from counties across the SCAG region when adding data layers to CA LOTS. County data were provided in different formats and it was difficult to extract common indicators to build the tool. SCAG suggested that it might be helpful to develop common data standards among agencies to ensure comparable datasets for future efforts. Identifying the appropriate data scale was done on a case-by-case basis.
Several municipalities expressed concern about sharing sensitive land use data through the local sustainability planning tool. Additionally, the tool currently requires ArcGIS 9.3 software, limiting its use by some agencies. SCAG anticipated that the web-based version of the local sustainability planning tool will help improve its accessibility.
Livability-Related Benefits
CA LOTS
SCAG reported several livability-related benefits to using CA LOTS, including the following:
- CA LOTS has allowed users access to a comprehensive information and online mapping portal for regional planning and land development analysis. Users such as planners and developers can target geographic opportunities for infill and TOD. For example, the Los Angeles County Metropolitan Transportation Authority and the Los Angeles County Department of Regional Planning accessed CA LOTS to complete an urban infill estimation study in 2008.58 UCLA has also used CA LOTS for studies performed under SCAG subregional contracts on behalf of the City of Los Angeles and Los Angeles County, as well as for a study involving the Los Angeles County Transportation Commission and the Los Angeles Neighborhood Initiative.59
- CA LOTS has broadened access to livability-related data because it is a free application. Many communities with interest in CA LOTS data cannot afford to purchase them and rely on having open access to CA LOTS. Because GIS expertise is not necessary to use CA LOTS, SCAG believes that the tool has helped to significantly broaden stakeholders' access to geospatial information, including access by the general public.
- CA LOTS has supported a more transparent, collaborative, and participative planning process by allowing users to “pick and choose” the data they would like to see in an interactive platform, share data with one another, and analyze information at detailed levels (e.g., the neighborhood scale).
Local sustainability planning tool
The tool has not yet been implemented in scenario planning workshops, but expected livability-related benefits include the tool's ability to give transportation planners, the public, and others a broader perspective on local land use activity and livability issues, especially as related to air quality, modal choice, and development types. SCAG also anticipated that the tool—through its use of visuals and a participative approach—will improve non-technical audiences' understanding of transportation and land use decision-making. Finally, SCAG believes that the tool will help support a more effective and collaborative planning process.
Additional Resources
- CA LOTS website: This website is no longer online.
- CA LOTS Evaluation Report60
- Local sustainability planning tool website: https://maps.pagregion.com/PAG-GIMap/
- Introduction to the Sustainability Tool, available at: https://maps.pagregion.com/PAG-GIMap/
- Local sustainability planning tool Users' Manual.61
OTHER APPLICATIONS
This section presents examples of other livability-related GIS projects in the transportation sector beyond those highlighted in the preceding case studies. The purpose is to highlight ongoing GIS activities as related to several areas with connections to livability, including trip planning, transit tracking, accessibility, vehicle sharing, neighborhood connectivity, and community visualization.
Introduction
The development of new geospatial technologies has changed the landscape of GIS and spatial applications. The prevalence of livability-related GIS can be attributed to several factors, including the collection of spatial data by the public and private sectors, the packaging of spatial data in a way that allows information to be more easily manipulated and analyzed, and the availability of technologies that are able to disseminate this information to the end-user. Consequently, location-based data are now more easily shared and organizations are developing improved ways to use and display these data on an ongoing basis. Spatial data and analysis have become seemingly ubiquitous; limitless opportunities exist in both private and public sectors to use geographic information to promote efficiency, better decision-making, and greater awareness of the environment.
A key component for many GIS applications that support livability is the use of open data, whereby spatial information and dissemination tools are made readily available to all who are interested. In addition to more traditional data procurement methods in the engineering and planning industries, open data and information sharing allows third-party developers to create new tools and applications. Many of these new tools focus on user collaboration and provide opportunities for increased user interactivity, which are cornerstones for many GIS applications that support livability.
The trend toward open data is becoming institutionalized in government. In December 2009, the Federal Office of Management and Budget (OMB) issued a directive to promote a culture of open government, requiring Federal executive agencies to publish high-value data sets for public consumption on websites that allow public feedback and input.62 A January 2009 Presidential Memorandum,63 later clarified the OMB directive, stated that government should be transparent, participatory, and collaborative. The memorandum underscored the Federal government's commitment to transparency and accountability—particularly through use of innovative tools and methods—as a way to support public involvement, collaboration, and citizen engagement.
The use of location-based or content-aware mobile applications that can provide and obtain “on the street,” real-time information is another increasingly prevalent trend.64 These mobile applications are broadening access to geospatial data by providing information on an on-demand basis that is highly customized to users' specific preferences, location, or needs.65 The goals of many open-source applications intersect with those of livability through their focus on user collaboration and interactivity, providing information to support better decision-making, and communicating location-specific information.
In addition to the case studies developed for this report, numerous examples of livability-related GIS projects are visible throughout the transportation sector. The following section highlights several examples of ongoing activities related to trip planning, transit tracking, vehicle sharing, accessibility, neighborhood connectivity, and community visualization.
Trip Planning
One of the most common applications of spatial information is for trip planning, or creating customized driving, walking, bicycling, or transit routes based on user input and preferences.
Example: Google Maps
Like many of the commercial online mapping tools that exist today (e.g., MapQuest, Yahoo Maps, Bing), Google Maps entered the online mapping world by providing step-by-step driving directions. Since then, Google Maps has collected sufficient data to provide travel directions and times for transit riders, bicyclists, and pedestrians, and also offers geo-coded “street views” throughout much of the United States.
With regard to transit, Google helped develop the open-source General Transit Feed Specification (GTFS [originally Google Transit Feed Specification]) as a uniform data format so that all transit agencies could participate and be represented in Google Maps. GTFS relies on both spatial and time-based data to create a successful trip planning application for bus and train routes and schedules. The tool is also capable of providing biking and walking directions.
By developing GTFS, Google created a standard that renders each participating transit agency's map and schedule into a data format that is openly accessible to the public. Thus Google Maps provides a foundation for numerous “spin-off” applications (often those based on mobile devices), which offer trip planning and service advisory information in real-time.66
Google Maps also makes its automated programming interface (API) available to the general public, and the basemap can be seen on numerous websites (including a few in this report).
For more information, see https://maps.google.com.
Example: A-Train
The Atlanta Transit Rider's Advocacy and Information Network (A-Train) is a multimodal trip planning tool that allows users to enter specified location information for the Atlanta, Georgia, region and then determine a customized walking-only route, a biking-only route, a route that involves walking to transit, or a route that involves biking to transit (See Figure 16).
Citizens for Progressive Transit, a grassroots transit advocacy organization based in Atlanta, launched the website in 1997. The site utilizes an open-source software package called Five Points, integrated with the Google Maps API. The tool supports livability in providing information that improves the public's transportation decision-making and leveraging existing transportation opportunities in a community.
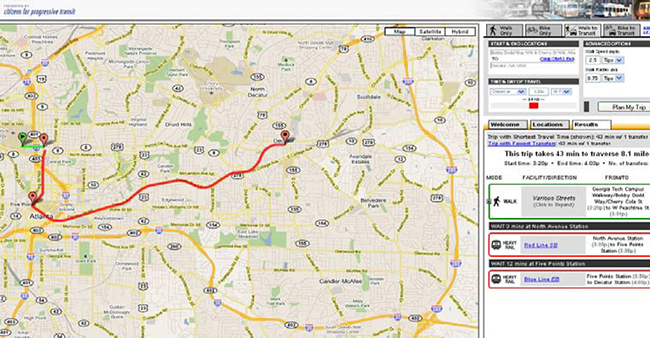
Figure 16. A-Train screenshot. Note that the green line represents the walking portion of the trip and the red line represents the transit portion.
Transit Tracking
Transit tracking applications use real-time spatial information tools that allow individuals to see the location of a transit vehicle and better anticipate its arrival. A central component for all vehicle tracking applications is the use of global positioning systems (GPS), used in conjunction with GIS, to provide highly customized and on-demand information that is based on a user's specific current location.
Example: NextBus, Inc.
NextBus is a transit tracking application that has been deployed in 23 states, Washington, DC, and several Canadian provinces. NextBus combines GPS data with a predictive software to predict arrival and departure times for transit systems.
The NextBus system works by communicating the real-time position of vehicles (each equipped with a satellite tracking system) to an information center, which then analyzes the position of each vehicle and predicts its arrival time with reference to typical traffic patterns and the number of scheduled stops for the vehicle. Users access NextBus via the internet on a computer or a wireless mobile device. Data are regularly updated to ensure that users have the most accurate information possible.
The system supports livability by providing information that allows users to make better and more informed transportation decisions, particularly around utilization of transit. It also supports ways for transit operators to communicate more effectively with customers. Finally, it seeks to promote transit by removing barriers to its use, specifically long wait times and uncertain arrival times, which have historically been challenges.
For more information, see https://retro.umoiq.com.
Vehicle Sharing
Having grown in popularity in several urban centers in Europe and America, car sharing and bike sharing membership programs offer services to the public for short-term personal transportation needs. Most organizations use GIS to track vehicles and information on real-time vehicle locations is usually disseminated to members via the Google Maps API.
Example: Zipcar
Zipcar is a tracking application focused on vehicle sharing. Individuals purchase Zipcar memberships that allow them to reserve a car at a convenient location, drive the car for a specified period of time, and return the car to be used by another member. Zipcar uses GPS data to track vehicles and, in conjunction with the Google Maps API, allow members to easily find cars using the internet via a computer or mobile device (see Figure 17).
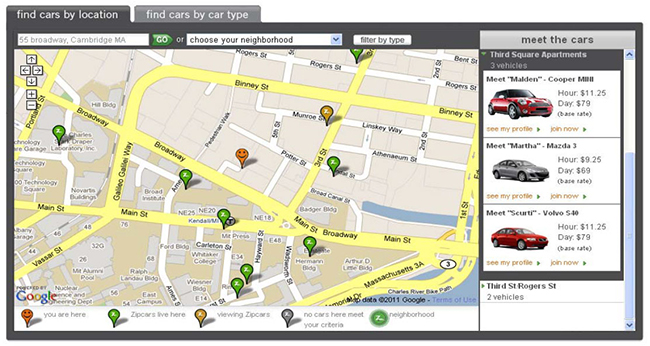
Figure 17. Zipcar screenshot showing Zipcar locations near Cambridge, MA.
Zipcar takes advantage of several spatial technologies. Zipcar Mobile Locator is a GPS-based phone application that allows members to view and reserve cars based on current location. The application was launched using WHERE, a GPS platform used for a variety of location-based queries.67 Zipcar's online reservation system features a Google Map mashup showing the real-time location of reservable cars as well as the type of car available in that location.68
Zipcar supports several livability principles, including reducing unnecessary car trips and thus limiting GHG emissions. Members in some areas have also reported increasing their overall use of public transportation after joining Zipcar or selling their personal vehicles.69 Zipcar's Fast Fleet is a program for government managers to use Zipcar technologies for business fleets. The program aims to support sustainability by allowing managers to optimize the location and configuration of their fleets and better assess employees' business driving activities.70
For more information, see www.zipcar.com/.
Example: Capital Bikeshare
In recent years, urban bicycle sharing operations have sprung up in a number of cities in the U.S. and abroad. An important component of these programs is their ability to track bicycles with GPS and provide real-time bicycle location information to their members via integrated online mapping and the Google Maps API (see Figure 18).
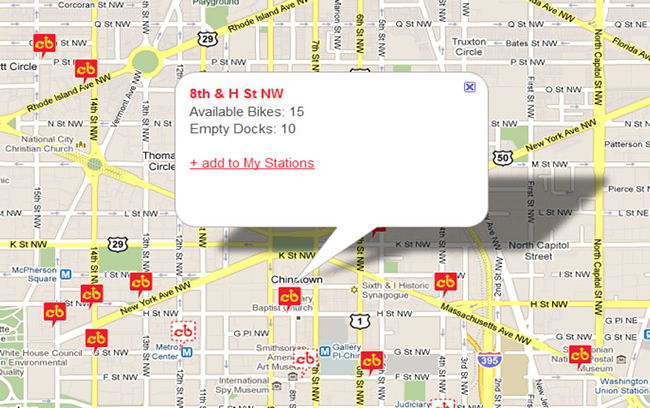
Figure 18. Capital Bikeshare screenshot. Note that each station show the number of available bikes and the number of empty docks.
Capital Bikeshare is one example of a bike share program that uses geographic information to track the location of its bikes. Supported by many partners, including FHWA, Capital Bikeshare offers over 1,100 bicycles at 114 stations through the metropolitan Washington, D.C., area.71
Bicycle sharing supports livability by offering additional options for short-trip travel. Online mapping is an important component of the modern bike share program, allowing users to easily see when and where bicycles are available. GIS also allows bike share operators to track usage trends and realign resources based on user demand.
For more information, see capitalbikeshare.com.
Accessibility
Accessibility is a person's ability to visit destinations that are required to satisfy basic human needs. Accessibility applications seek to empower the public by improving one's ability to make well-informed and efficient travel decisions. These tools are important for transportation and land use planning. Additionally, they affect the residential and commercial real estate industries as buyers and sellers recognize opportunities associated with walking and transit in certain markets.72
Example: Access to Destinations
The University of Minnesota's Center for Transportation Studies is currently collaborating on a five-year Access to Destinations Study with the Minnesota Department of Transportation, Hennepin County (Minnesota), the Metropolitan Council (the metropolitan planning organization for the Twin Cities region in Minnesota), and the McKnight Foundation. The study is based on the concept of accessibility.73
The study is divided into three research components: Understanding Travel Dimensions and Reliability; Measuring Accessibility; and Exploring Implications of Alternative Transportation and Land Use Systems. As part of the second component (Measuring Accessibility), the project team developed an “accessibility matrix” that captures variations in accessibility as related to different types of destinations in the Twin Cities region for travelers who drive, bike, walk, or use transit. The GIS-based tool (Figure 19) allows users to choose a destination, such as a workplace, a school, or a shopping center, and easily compare travel times for each mode of transportation. Plans are in place to deploy the matrix as a scenario planning tool, allowing transportation and land use decision-makers to estimate the effect on accessibility of transportation improvements (vehicles lanes, bike lanes, transit routes, walking paths) and development (housing, shopping, and employment centers).74
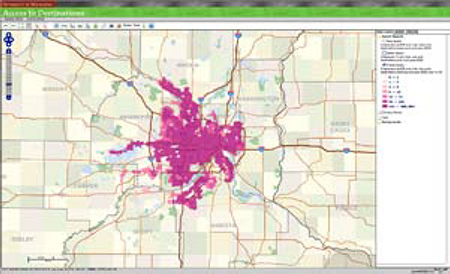
Figure 19. Access to Destinations Study.
Example: Walk Score
Walk Score rates the walkability of a given address on a scale of one to 100. The assessment is based on the location's distance to a list of pre-set amenities, such as coffee shops, shopping areas, and schools.
The walkability score is directly related to the number of amenities within a short distance of a location (defined as between one-quarter of a mile and one mile), so a high walkability score reflects a large numbers of nearby amenities.75 Amenities are weighted according to what relevant literature has identified as primary motivators for walking. Walk Score then applies an algorithm to assess scores for each amenity category. These scores are then multiplied and summed to reach the total walkability score. The application also allows a user to customize his or her route based on desired amenities. Walk Score does not currently measure some attributes of walkability, such as street design, safety, and block length, but is developing a new application called “Street Smart” Walk Score to take these issues into consideration when calculating the algorithm and overall walkability score.
A companion application, Transit Score, uses a similar methodology but is focused on “usefulness” of transit as assessed by the extent to which a transit route offers stops close to the user, the frequency of the route, and type of route (e.g., bus, rail).
Both applications use open source GIS data from a variety of sources, including transit agencies, Open Street Map (www.openstreetmap.org), schools, and local business listings. See www.walkscore.com/.
Neighborhood Connectivity
GIS can be used to analyze transportation connectivity in both single and multimodal capacities. Connectivity is recommended by the U.S. Green Building Council (USGBC) for its Leadership in Energy and Environmental Design (LEED) Neighborhood Development certification as a way to encourage development that promotes transportation efficiency through multimodal transportation.76
Example: INDEX
INDEX, which is an extension of ESRI's ArcGIS software package, was developed by the land use planning firm Criterion Planners based in Portland, Oregon. The firm sought to create a tool that would allow a community to use objective data to quantify connectivity, using a technique called intersection density. Intersection density serves as a method to ensure travel routes are fully connected and multiple transportation options are available.
INDEX is currently being tested by the Maryland National Capital Planning and Parks Commission in Montgomery County, Maryland. The county's transportation planners aim to use INDEX to provide an assessment of transportation connectivity throughout the county. The primary challenge in the effort is gathering the necessary data to provide a county-wide assessment of connectivity, as not all transportation routes (bike paths, sidewalks, walking trails, etc.) have been digitally mapped.
The concept of connectivity supports livability in a similar way to that of the USGBC's LEED Neighborhood Development program. Many of USGBC's “green” values focus on limiting automobile trips and promoting multimodal transportation systems that support physical activity and public health. These goals are aligned with those of the USDOT, EPA, and HUD livability initiative.77
Community Visualization
Visualization applications focus on illuminating the relationship of transportation to the built environment through organizing, manipulating, and assessing spatial data. By combining GIS data with the power of modern graphic imaging, these tools can allow stakeholders to “see” how development choices affect the neighborhood environment.
Example: CommunityViz
Developed by the planning and technology firm Placeways, LLC in partnership with the non-profit Orton Family Foundation, CommunityViz is a GIS tool that facilitates scenario-based planning by creating three-dimensional virtual landscapes based on various land use scenarios78. The purpose of CommunityViz is to allow the public to visualize alternative futures and better understand the implications of development decisions over time, and it has been used in [more than 40] communities in the U.S. and abroad.79
The CommunityViz tool operates as an extension to ESRI's ArcGIS software, meaning that it can only be used in conjunction with ArcGIS. The arrangement allows CommunityViz to be relatively affordable for agencies that already own a license to operate ArcGIS.
APPENDIX A: LIST OF INTERVIEW PARTICIPANTS
City of Boulder Transportation Division
- Larry Ferguson – fergusonL@bouldercolorado.gov
- Randall Rutsch – rutschr@ci.boulder.co.us
Center for Neighborhood Technology
- Peter Haas, PhD – pmh@cnt.org
- Linda Young – linda@cnt.org
Southern California Association of Governments
- Joe Carreras – carreras@scag.ca.gov
- Jung A Uhm – uhm@scag.ca.gov
- Ping Chang – chang@scag.ca.gov
- Bernard Lee – leeb@scag.ca.gov
- Norman Wong (University of California-Los Angeles, Institute of Transportation Studies) – wongn@spa.ucla.edu
- Charanjeet Singh (University of California-Los Angeles CNT) – charan@ucla.edu
University of Oregon/OTREC
- March Schlossberg – schlossb@uoregon.edu
APPENDIX B: ADDITIONAL RESOURCES
This appendix includes examples of additional resources that explore, assess, or support GIS tools for livability. These examples, which are not inclusive, are presented only for informative purposes. FHWA does not endorse any specific resource.
Examples of Research Papers
Development and application of a livable environment evaluation support system using Web GIS (2004)
This research paper explores development of a web-based GIS system to identify preferences for livable environments. The system seeks to define what livability “means” for individuals, assess the conduciveness of various areas according to these definitions, and visualize the results to support individuals' decision-making. The paper identifies components of a GIS, such as an evaluating structure, which are required to build this type of system.
See: https://link.springer.com/article/10.1007/s10109-004-0135-2
Envisioning Neighborhoods with TOD Potential (2002)
This paper summarizes a study conducted by the Mineta Transportation Institute at San José State University. The study used GIS tools to assess and compare neighborhoods located near transit centers at a high level of detail. The aims of the study were to better understand what components of these neighborhoods make them desirable for residents and thereby help developers identify areas conducive for further TODs.
See: https://transweb.sjsu.edu/research/Envisioning-Neighborhoods-TOD-Potential
Examples of Online Resources
American Planning Association: www.planning.org
Association of American Geographers: www.aag.org
Federal Geographic Data Committee: www.fgdc.gov
FHWA GIS in Transportation: www.gis.fhwa.dot.gov
National Geospatial Program: https://www.usgs.gov/programs/national-geospatial-program
New Tools for Community Design and Decision Making—An Overview: http://crowdsynergy.wdfiles.com/local--files/tools-for-community-design-and-decision-making/Chapter%20on%20TCDDM%20in%20Planning%20Support%20Systems%20in%20Practice2003.pdf
Planetizen: www.planetizen.com
Streets Blog: www.streetsblog.org
Urban and Regional Information Systems Association: www.urisa.org
USGBC LEED Neighborhood Development Program: www.usgbc.org/leed/nd
U.S. DOT Livability Homepage
APPENDIX C: GIS TOOL CATEGORIZATION
The table below shows the three general ways in which GIS tools support livability and provides some examples for each category (several examples illustrate multiple categories). Bolded applications are those highlighted in the case studies.
| Example of GIS Tool | Support of Livability | ||
|---|---|---|---|
| Decision-Making | Highlighting Connections |
Consensus Building |
|
| A-Train | x | ||
| Access to Destinations | x | x | x |
| Capital Bikeshare | x | ||
| CA LOTS (SCAG) | x | x | |
| Community Viz | x | x | |
| Google Maps | x | ||
| H + T Index (CNT) | x | x | |
| INDEX | x | x | |
| Local sustainability tool (SCAG) | x | x | x |
| Map It (City of Boulder) | x | x | |
| Multimodal corridor GIS analysis (City of Boulder) |
x | x | |
| Next Bus | x | ||
| Participatory GIS applications (University of Oregon and OTREC) |
x | x | |
| Walk Score/Transit Score | x | x | |
| Zipcar | x | ||
FOOTNOTES
| 1 | Elizabeth Sanford. “How to Define and Measure Livability Factors.” 2010. Available at https://onlinepubs.trb.org/onlinepubs/conferences/2010/livability/Sanford.pdf. |
| 2 | The partnership was formed in 2009. For additional information, see https://www.epa.gov/smartgrowth. |
| 3 | EPA. “Growing Smarter, Living Healthier.” August 2009 report. Available at https://www.aarp.org/livable-communities/act/planning-land-use/info-12-2012/growing-smarter-living-healthier-a-guide-to-smart-growth-active-aging.html. |
| 4 | https://smartgrowthamerica.org/program/national-complete-streets-coalition/ |
| 5 | smartgrowth.org |
| 6 | 6 See the EPA's report: “Growing Smarter, Living Healthier.” |
| 7 | For more information on sustainable transportation strategies, see Elizabeth Deakin. “Sustainable Development and Sustainable Transportation: Strategies for Economic Prosperity, Environmental Quality, and Equity.” May 2001. Available at https://escholarship.org/uc/item/0m1047xc. |
| 8 | Congress for the New Urbanism. “Charter of the New Urbanism.” 1996. Available at https://www.cnu.org/who-we-are/charter-new-urbanism. |
| 9 | FHWA. “Mitigating Traffic Congestion: The Role of Demand-Side Strategies.” October 2004. Available at www.ops.fhwa.dot.gov/publications/mitig_traf_cong/index.htm#toc. |
| 10 | See also the chapter on community livability from the online Transportation Demand Management Encyclopedia. 2008. Available at: www.vtpi.org/tdm/tdm97.htm. |
| 11 | See “Geographic Information Systems A Tool for Improving Community Livability.” Available at https://www.legacy.civicwell.org/resource/gis/. |
| 12 | Marc Schlossberg. “Engaging Communities, Improving Neighborhoods.” March 2010. Available at www.planetizen.com/node/43228. |
| 13 | Sammy Zahran et al. “Cycling and Walking: Explaining the spatial distribution of healthy modes of transportation in the United States.” 2008. Available from ScienceDirect at www.sciencedirect.com/. |
| 14 | Mineta Transportation Institute. “Effect of Suburban Transit Oriented Developments on Residential Property Values.” 2008. Available at https://transweb.sjsu.edu/research/Effect-Suburban-Transit-Oriented-Developments-Residential-Property-Values. |
| 15 | CEO For Cities. “Walking the Walk: How Walkability Raises Home Values in U.S. Cities.” August 2009. No longer available. |
| 16 | Mineta Transportation Institute. “GIS for Livable Communities: Examination of Community Perceptions of Assets, Liabilities and Transportation Improvements.” 2001. Available at: https://transweb.sjsu.edu/research/GIS-Livable-Communities-Examination-community-Perceptions-Assets-Liabilities-and-Transportation-Improvements. |
| 17 | See also K. Serrano, T. Horan, and G. McMurran, “Accessing Community Livability Through GIS.” 2009. Paper presented at the annual meeting of the American Political Science Association, Boston Marriott Copley Place, Sheraton Boston & Hynes Convention Center, Boston, Massachusetts Online. No longer available. |
| 18 | For additional information on the Transportation Division, see https://bouldercolorado.gov/government/departments/transportation-mobility. |
| 19 | Map no longer available. |
| 20 | Statistics from 2009. |
| 21 | For additional information on Boulder's history with growth management, see https://livableboulder.org/boulders-secret-limited-growth/boulders-growth-a-succinct-history/. |
| 22 | Information on Go Boulder is no longer available. |
| 23 | See https://bouldercolorado.gov/services/bike. |
| 24 | See also https://bouldercolorado.gov/projects/transportation-master-plan. |
| 25 | See also https://bouldercolorado.gov/projects/transportation-master-plan. |
| 26 | The 2003 TMP is no longer available. An updated TMP is available at https://bouldercolorado.gov/projects/transportation-master-plan. |
| 27 | Maps are available at https://bouldercolorado.gov/maps. |
| 28 | Note that the Arapahoe multimodal corridor is outlined in black. This screenshot also shows the map legend on the left-hand side. |
| 29 | Additional information on the methodology is available at https://bouldercolorado.gov/projects/transportation-master-plan. |
| 30 | “L” means low, “M” means medium, “H” means high, etc. |
| 31 | From https://bouldercolorado.gov/projects/30th-and-colorado-corridors-study. |
| 32 | For the city's most recent area plan on the Boulder Transit Village (Boulder Junction), see https://bouldercolorado.gov/projects/boulder-junction-phase-2. |
| 33 | More information on CNT is available at: cnt.org. |
| 34 | Available at https://htaindex.cnt.org/. |
| 35 | For more information, see The Affordability Index: A New Tool for Measuring the True Affordability of a Housing Choice (https://www.brookings.edu/research/the-affordability-index-a-new-tool-for-measuring-the-true-affordability-of-a-housing-choice/) and The Heavy Load: The Combined Housing and Transportation Burdens of Working Households, a report the Center for Housing Policy published using H + T data that CNT compiled for working families in 28 metropolitan areas. |
| 36 | The University of Minnesota developed MapServer. |
| 37 | Source for graphic is: https://htaindex.cnt.org/about/. |
| 38 | The H + T analysis that CNT produced for MWCOG, in partnership with The Terwilliger Center for Workforce Housing of the Urban Land Institute (ULI) and the Center for Housing Policy, resulted in the report, The Beltway Burden: The Combined Cost of Housing and Transportation in the Greater Washington, DC Metropolitan Area available at https://cnt.org/sites/default/files/publications/CNT_BeltwayBurdenCombinedCostofH%2BT.pdf. |
| 39 | For more information on the H + T affordability analysis for El Paso, TX see https://www.cnt.org/projects/redefining-housing-affordability. |
| 40 | Available at http://abogo.cnt.org/. |
| 41 | Available at http://tei.cnt.org/. |
| 42 | Website no longer available. |
| 43 | Website no longer available. |
| 44 | See the “Active Transportation, Neighborhood Planning and Participatory GIS” report, page 5. |
| 45 | Dr. Kelly Clifton, Andrea Livi, and Daniel Rodriguez. Pedestrian Environment Data Scan. See https://rebeccaelee.weebly.com/pedestrian-environment-data-scan-peds.html. |
| 46 | See the “Active Transportation, Neighborhood Planning and Participatory GIS” report. |
| 47 | See the “Active Transportation, Neighborhood Planning and Participatory GIS” report. |
| 48 | See the “Transferring Community-Based Active Transportation GIS Assessment Tools Nationwide” report, page 17. |
| 49 | See the “Transferring Community-Based Active Transportation GIS Assessment Tools Nationwide” report, pages 17-18. |
| 50 | “Transferring Community-Based Active Transportation GIS Assessment Tools Nationwide” report. |
| 51 | For additional information on SB 375, see https://ww2.arb.ca.gov/our-work/topics/sustainable-communities. |
| 52 | For additional information on SCAG's approach to meeting SB375 requirements, see https://gisdata-scag.opendata.arcgis.com/. |
| 53 | For additional information on Compass Blueprint, see https://scag.ca.gov/sustainability. |
| 54 | SCAG and UCLA's CNK previously partnered on TOD-related projects, including an effort to develop data on parcels in proximity to transit services and an effort to identify areas where light industry uses could be converted to residential or mixed uses. |
| 55 | The effort to develop the H + T Index is described elsewhere in this report. See the CNT case study. |
| 56 | Envision Tomorrow software was built by Fregonese Associates. It is a geographic information systems (GIS) tool to support stakeholders in modeling and assessing land use scenarios. For more information, please see https://frego.com/envision-tomorrow/. |
| 57 | An initial project team that oversaw the development of the tool includes staff members from SCAG's Research, Analysis and Information Services Department. |
| 58 | For additional information on the infill estimation study, see https://planning.lacounty.gov/assets/upl/project/housing_2008-infill-study-phaseii.pdf (Content no longer available). |
| 59 | LANI is a nonprofit organization dedicated to promoting community-driven neighborhood revitalization. More information on LANI and its projects is available at www.lani.org. |
| 60 | Available upon request from SCAG. |
| 61 | Available upon request from SCAG. |
| 62 | Link/content no longer available. |
| 63 | Link/content no longer available. |
| 64 | See the Global Geospatial Magazine. “The Creative Destruction of GIS.” January 2010. Available at https://www.geospatialworld.net/magazines/geospatial-world-magazine/. |
| 65 | Scientific Research and Essay. “Future IT Trends for GIS/Spatial Information Management.” May 2010. No longer available. |
| 66 | “Traveler Information Systems and Wayfinding Technologies in Transit Systems.” Federal Transit Administration. November 2010. p 45. Also available at https://www.itskrs.its.dot.gov/its/benecost.nsf/ID/f605c83903a488a885257f1f00727174?OpenDocument=. |
| 67 | Link/content no longer available. |
| 68 | For more on an environmental case study of Zipcar that explores its use of spatial technologies, see https://doee.dc.gov/service/case-study-zipcar. |
| 69 | Link no longer available. |
| 70 | See http://multivu.prnewswire.com/mnr/zipcar/38015/. |
| 71 | See https://ride.capitalbikeshare.com/about. |
| 72 | No longer available. |
| 73 | No longer available. |
| 74 | No longer available. |
| 75 | See also CEO For Cities. “Walking the Walk: How Walkability Raises Home Values in U.S. Cities.” August 2009. |
| 76 | “LEED 2009 for Neighborhood Development Rating System.” U.S. Green Building Council, 2009, p 45. |
| 77 | “LEED 2009 for Neighborhood Development Rating System.” U.S. Green Building Council, 2009, p xi. |
| 78 | For more information see https://communityviz.city-explained.com/. |
| 79 | For more information see https://communityviz.city-explained.com/. |
| 80 | Source: https://www.communityheartandsoul.org/. |


